Jan 31, 2025
“..you don't understand things, you just get used to them.”— John von Neumann
For a while now I've been advocating for a particular style of programming:
- Use tools that don't change too often.
- Use tools that don't keep historical accidents around indefinitely.
- Minimize moving parts. Avoid additional third-party libraries, and forswear native libraries entirely.
Lua and LÖVE have been one nice way to get these properties. As I've used them, I've enjoyed an additional benefit: the ubiquitous presence of a canvas I can draw on as I program. This has been new to me with my erstwhile conservative and terminal-bound habits, and I've been pushing myself to lean more on graphics to understand what my programs are doing. Here I want to share one such experience. I'm using my run-anywhere Lua Carousel app, and you can paste the programs directly into it, but the workflow translates to any platform with a canvas.
A few weeks ago Jack Rusher shared a baffling function to compute the Hilbert curve. Here it is, translated to Lua:
function h(x, y, xi, yi, xj, yj, n) if n <= 0 then return {x+xi/2+xj/2, y+yi/2+yj/2} end return array_join( h(x, y, xj/2, yj/2, xi/2, yi/2, n-1), h(x+xi/2, y+yi/2, xi/2, yi/2, xj/2, yj/2, n-1), h(x+xi/2+xj/2, y+yi/2+yj/2, xi/2, yi/2, xj/2, yj/2, n-1), h(x+xi/2+xj, y+yi/2+yj, -xj/2, -yj/2, -xi/2, -yi/2, n-1)) endWhen I first looked at it, I could see a few superficial facts:
- It returns an array of points containing x and y coordinates.
- It's recursive. There's a base case for “leaf” calls, and each non-base case makes 4 recursive calls.
- Only the base case actually “draws” by adding points to the result.
- Non-leaf calls recursively partition the given square into 4 quadrants. Square size (the xi/yi/xj/yj) is being halved each time.
But the details were still unclear. Why the swaps/rotations? Why the negative signs in one of the 4 quadrants? Looking for answers led me to several iterations and some graphical infrastructure that promises to help with my next debugging task.
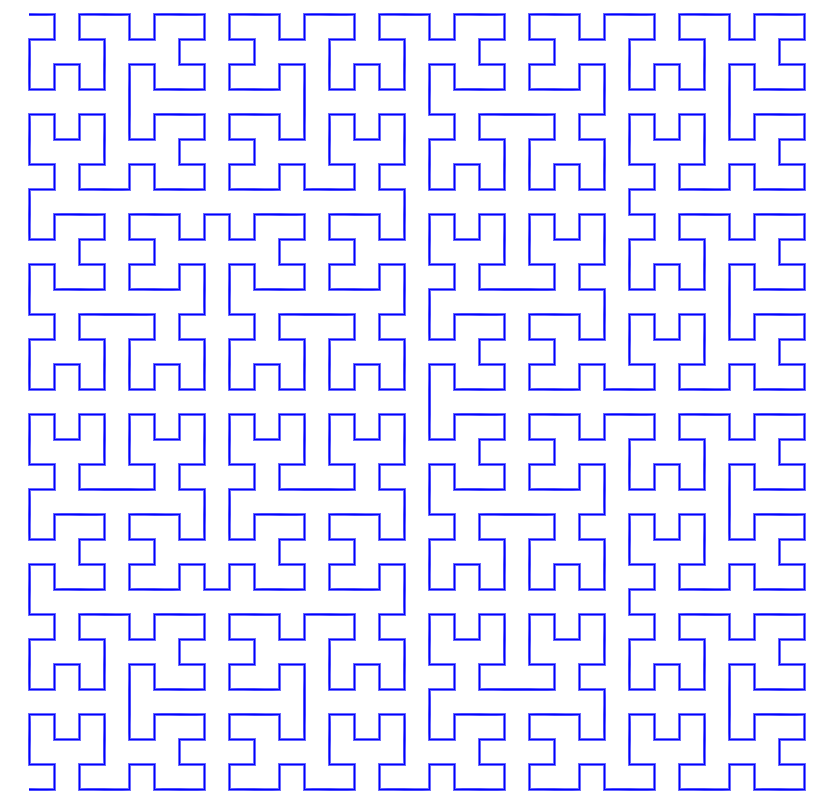
v1: The first thing to look at is the curve itself.
 code
function h(x, y, xi, yi, xj, yj, n)
if n <= 0 then
return {x+xi/2+xj/2, y+yi/2+yj/2}
end
return array_join(
h(x, y, xj/2, yj/2, xi/2, yi/2, n-1),
h(x+xi/2, y+yi/2, xi/2, yi/2, xj/2, yj/2, n-1),
h(x+xi/2+xj/2, y+yi/2+yj/2, xi/2, yi/2, xj/2, yj/2, n-1),
h(x+xi/2+xj, y+yi/2+yj, -xj/2, -yj/2, -xi/2, -yi/2, n-1))
end
function array_join(...)
local result = {}
for i, arg in ipairs{...} do
for _,x in ipairs(arg) do
table.insert(result, x)
end end
return result
end
local pts = h(60, 60, 800, 0, 0, 800, 5)
function car.draw()
color(0,0,1)
line(unpack(pts))
end
code
function h(x, y, xi, yi, xj, yj, n)
if n <= 0 then
return {x+xi/2+xj/2, y+yi/2+yj/2}
end
return array_join(
h(x, y, xj/2, yj/2, xi/2, yi/2, n-1),
h(x+xi/2, y+yi/2, xi/2, yi/2, xj/2, yj/2, n-1),
h(x+xi/2+xj/2, y+yi/2+yj/2, xi/2, yi/2, xj/2, yj/2, n-1),
h(x+xi/2+xj, y+yi/2+yj, -xj/2, -yj/2, -xi/2, -yi/2, n-1))
end
function array_join(...)
local result = {}
for i, arg in ipairs{...} do
for _,x in ipairs(arg) do
table.insert(result, x)
end end
return result
end
local pts = h(60, 60, 800, 0, 0, 800, 5)
function car.draw()
color(0,0,1)
line(unpack(pts))
end
This uses some some abbreviations from Lua Carousel. We save the list of points and draw them as a polyline.
Compare the L-system based implementation on Wikipedia: code function lsys(s) local result = {} for i=1,#s do local c = s:sub(i,i) if c == 'A' then table.insert(result, '+BF-AFA-FB+') elseif c == 'B' then table.insert(result, '-AF+BFB+FA-') else table.insert(result, c) end end return table.concat(result) end function draw_lsys(s) for i=1,#s do local c = s:sub(i,i) if c == 'F' then forward() elseif c == '+' then left() elseif c == '-' then right() end end end function forward() local x2 = x+dirx*n local y2 = y+diry*n line(x,y, x2,y2) x,y = x2,y2 end function left() if dirx == 0 then dirx = diry diry = 0 else diry = -dirx dirx = 0 end end function right() if dirx == 0 then dirx = -diry diry = 0 else diry = dirx dirx = 0 end end x,y = 100,100 dirx,diry = 0,1 n = 10 g.setLineWidth(3) color(1,0,1, 0.1) s = 'A' for _ = 1,5 do s = lsys(s) end draw_lsys(s) There's nothing in common!
How does it work?!
v2: Print out the sequence of calls in Jack's program. code function h(x, y, xi, yi, xj, yj, n) print(x,y, xi,yi, xj,yj) if n <= 0 then return {{x=x+xi/2+xj/2, y=y+yi/2+yj/2}} end return array_join( h(x, y, xj/2, yj/2, xi/2, yi/2, n-1), h(x+xi/2, y+yi/2, xi/2, yi/2, xj/2, yj/2, n-1), h(x+xi/2+xj/2, y+yi/2+yj/2, xi/2, yi/2, xj/2, yj/2, n-1), h(x+xi/2+xj, y+yi/2+yj, -xj/2, -yj/2, -xi/2, -yi/2, n-1)) end function array_join(...) local result = {} for i, arg in ipairs{...} do for _,x in ipairs(arg) do table.insert(result, x) end end return result end h(0,0, 800,0, 0,800, 2)
To keep the output manageable, we'll look at just a second order Hilbert curve (so the final n input is 2). Running this results in the following output. 60 60 800 0 0 800 60 60 0 400 400 0 60 60 200 0 0 200 60 260 0 200 200 0 260 260 0 200 200 0 460 260 -200 -0 -0 -200 460 60 400 0 0 400 460 60 0 200 200 0 660 60 200 0 0 200 660 260 200 0 0 200 660 460 -0 -200 -200 -0 460 460 400 0 0 400 460 460 0 200 200 0 660 460 200 0 0 200 660 660 200 0 0 200 660 860 -0 -200 -200 -0 460 860 -0 -400 -400 -0 460 860 -200 -0 -0 -200 460 660 -0 -200 -200 -0 260 660 -0 -200 -200 -0 60 660 200 0 0 200
Looking at this, some facts are clear without needing to think too hard:
- xi/yi and xj/yj are axis-aligned. One of each pair is always 0.
- Exactly one of each pair xi/xj and yi/yj is 0. That explains why the above code sometimes adds both.
But what do those xi, yi, xj, yj parameters mean beyond the metronomic division by 2? It's still unclear.
v3: Let's look at Jack's original animation.
code function h(x, y, xi, yi, xj, yj, n) if n <= 0 then return {{x=x+xi/2+xj/2, y=y+yi/2+yj/2}} end return array_join( h(x, y, xj/2, yj/2, xi/2, yi/2, n-1), h(x+xi/2, y+yi/2, xi/2, yi/2, xj/2, yj/2, n-1), h(x+xi/2+xj/2, y+yi/2+yj/2, xi/2, yi/2, xj/2, yj/2, n-1), h(x+xi/2+xj, y+yi/2+yj, -xj/2, -yj/2, -xi/2, -yi/2, n-1)) end function array_join(...) local result = {} for i, arg in ipairs{...} do for _,x in ipairs(arg) do table.insert(result, x) end end return result end local pts = h(60, 60, 800, 0, 0, 800, 5) local curr_index = 0 local speed = 100 function car.draw() color(0,0,0) for i=2,curr_index do color(0,0,0) line(pts[i-1].x, pts[i-1].y, pts[i].x, pts[i].y) end end function car.update(dt) curr_index = curr_index + dt*speed if curr_index > #pts then curr_index = #pts end end
It shows the order in which leaf calls are computed, but that path is pretty complicated.
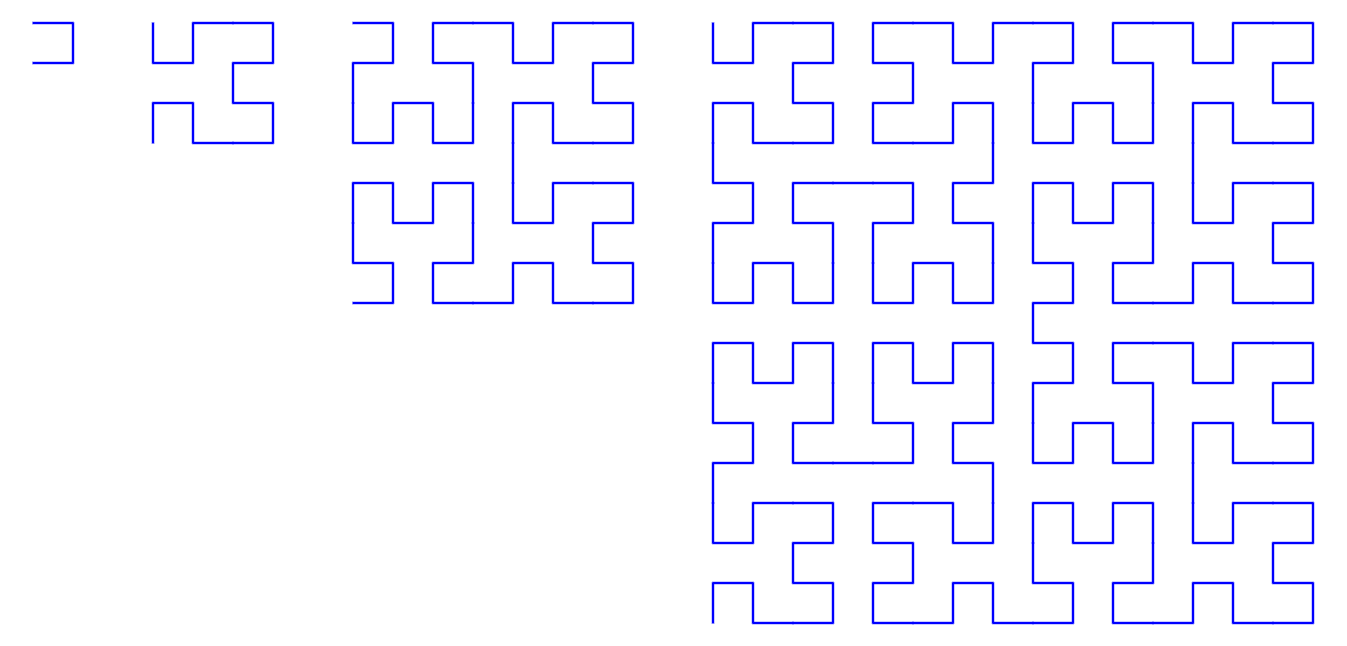
v4: Maybe it'll help to see a few iterations next to each other.
 code
function h(x, y, xi, yi, xj, yj, n)
if n <= 0 then
return {{x=x+xi/2+xj/2, y=y+yi/2+yj/2}}
end
return array_join(
h(x, y, xj/2, yj/2, xi/2, yi/2, n-1),
h(x+xi/2, y+yi/2, xi/2, yi/2, xj/2, yj/2, n-1),
h(x+xi/2+xj/2, y+yi/2+yj/2, xi/2, yi/2, xj/2, yj/2, n-1),
h(x+xi/2+xj, y+yi/2+yj, -xj/2, -yj/2, -xi/2, -yi/2, n-1))
end
function initialize_curves()
local pts = {}
local side = 80
local x, y = 60, 60
for n=1,4 do
table.insert(pts, h(x,y, side,0, 0,side, n))
x = x + side + 40
side = side*2
end
return pts
end
local pts = initialize_curves()
function car.draw()
color(0,0,1)
for _, pts in ipairs(pts) do
draw_lines(pts)
end end
function draw_lines(pts)
for i=2,#pts do
line(pts[i-1].x, pts[i-1].y, pts[i].x, pts[i].y)
end end
code
function h(x, y, xi, yi, xj, yj, n)
if n <= 0 then
return {{x=x+xi/2+xj/2, y=y+yi/2+yj/2}}
end
return array_join(
h(x, y, xj/2, yj/2, xi/2, yi/2, n-1),
h(x+xi/2, y+yi/2, xi/2, yi/2, xj/2, yj/2, n-1),
h(x+xi/2+xj/2, y+yi/2+yj/2, xi/2, yi/2, xj/2, yj/2, n-1),
h(x+xi/2+xj, y+yi/2+yj, -xj/2, -yj/2, -xi/2, -yi/2, n-1))
end
function initialize_curves()
local pts = {}
local side = 80
local x, y = 60, 60
for n=1,4 do
table.insert(pts, h(x,y, side,0, 0,side, n))
x = x + side + 40
side = side*2
end
return pts
end
local pts = initialize_curves()
function car.draw()
color(0,0,1)
for _, pts in ipairs(pts) do
draw_lines(pts)
end end
function draw_lines(pts)
for i=2,#pts do
line(pts[i-1].x, pts[i-1].y, pts[i].x, pts[i].y)
end end
Hmm, not so much. It's helpful to see the first iteration in particular. 4 calls yield 4 points, which string together into 3 lines that don't quite complete a square. But beyond that, it's still murky.
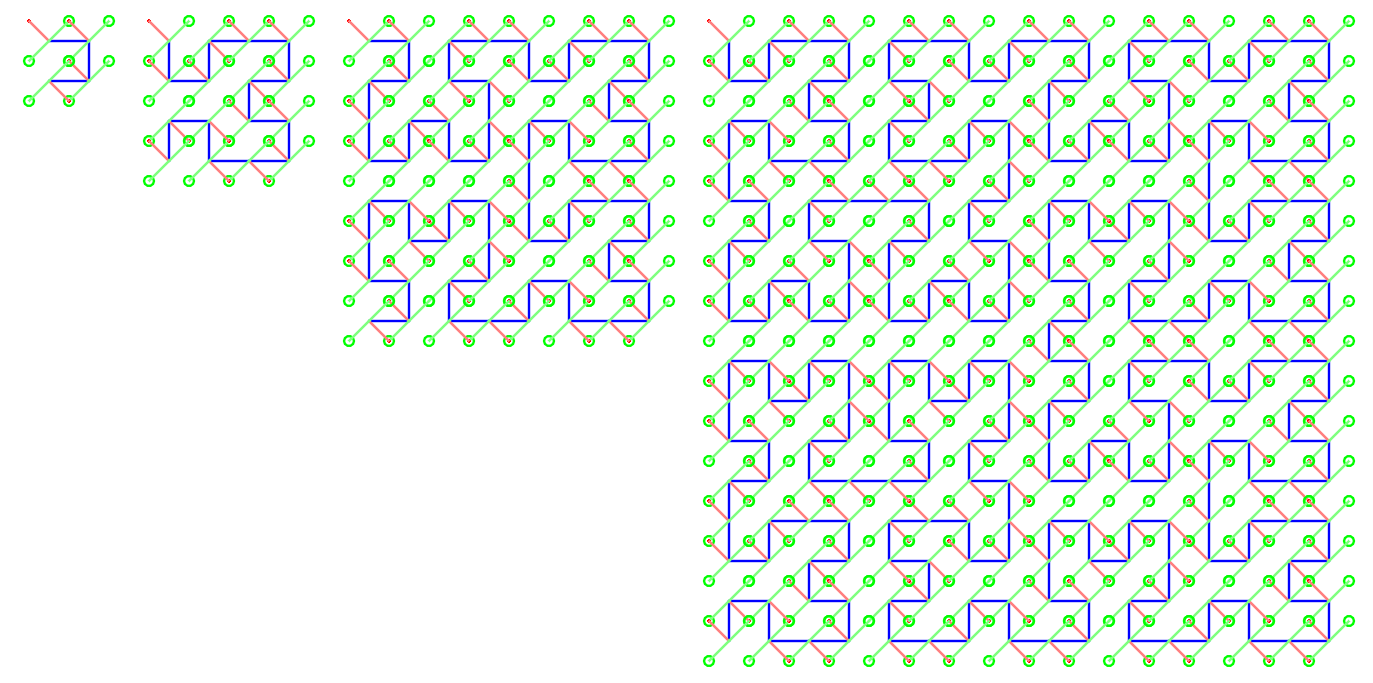
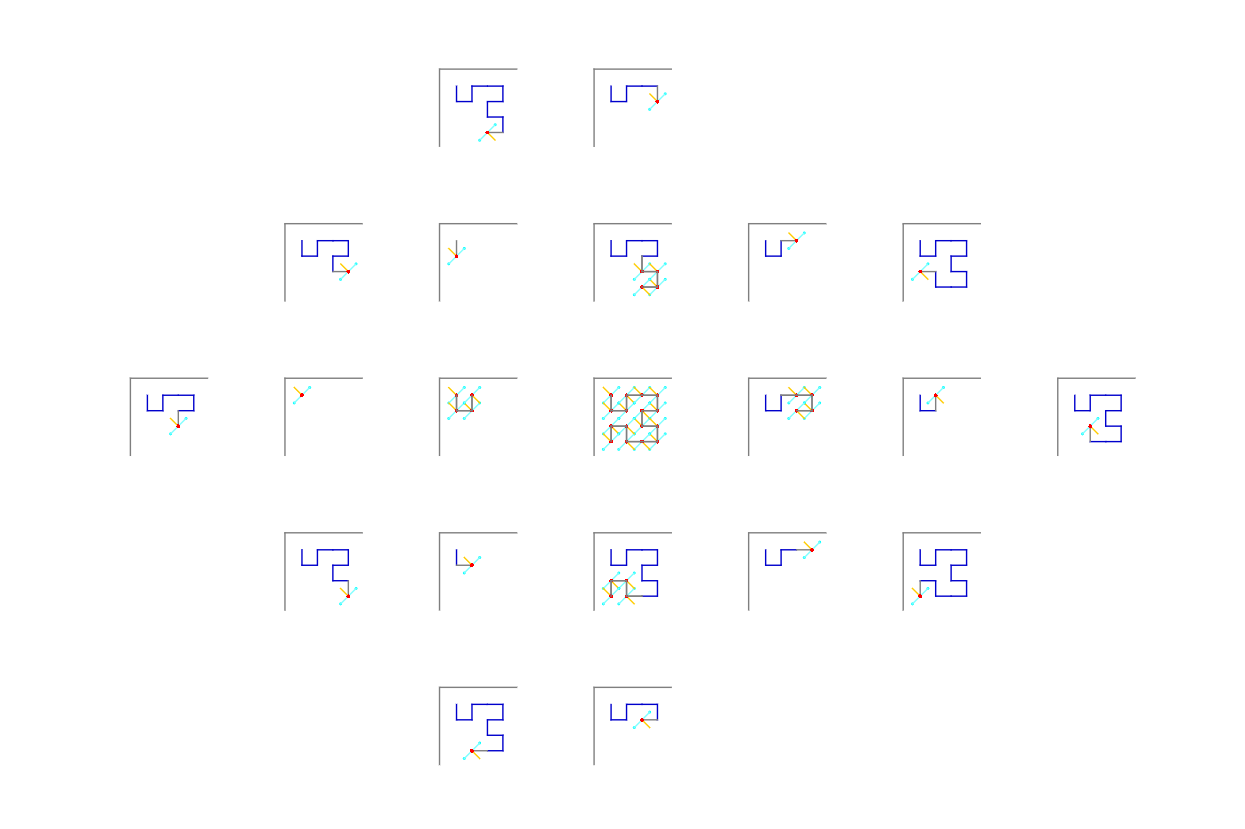
v5: As I said, only the leaf calls actually add any points. What if we show more details for each of them? Each leaf call uses 3 points on the way to adding one point to the result.
 code
function h(x, y, xi, yi, xj, yj, n)
if n <= 0 then
local resultx, resulty = x+xi/2+xj/2, y+yi/2+yj/2
local x3, y3 = x+xi, y+yi
local x4, y4 = x+xj, y+yj
local debug = {
{type='circle', drawmode='fill', x=x, y=y, radius=2, r=1,g=0,b=0},
{type='line', x1=resultx, y1=resulty, x2=x, y2=y, r=1,g=0.5,b=0.5},
{type='circle', drawmode='line', x=x3, y=y3, radius=5, r=0, g=1, b=0},
{type='line', x1=resultx, y1=resulty, x2=x3, y2=y3, r=0.5,g=1,b=0.5},
{type='circle', drawmode='line', x=x4, y=y4, radius=5, r=0, g=1, b=0},
{type='line', x1=resultx, y1=resulty, x2=x4, y2=y4, r=0.5,g=1,b=0.5},
}
return {{x = resultx, y = resulty, draw=debug}}
end
return array_join(
h(x, y, xj/2, yj/2, xi/2, yi/2, n-1),
h(x+xi/2, y+yi/2, xi/2, yi/2, xj/2, yj/2, n-1),
h(x+xi/2+xj/2, y+yi/2+yj/2, xi/2, yi/2, xj/2, yj/2, n-1),
h(x+xi/2+xj, y+yi/2+yj, -xj/2, -yj/2, -xi/2, -yi/2, n-1))
end
function array_join(...)
local result = {}
for i, arg in ipairs{...} do
for _,x in ipairs(arg) do
table.insert(result, x)
end end
return result
end
function initialize_curves()
local pts = {}
local side = 80
local x, y = 60, 60
for n=1,4 do
table.insert(pts, h(x,y, side,0, 0,side, n))
x = x + side + 40
side = side*2
end
return pts
end
local pts = initialize_curves()
function draw_hilbert(pts)
color(0,0,1)
g.setLineWidth(2)
for i=2,#pts do
line(pts[i-1].x, pts[i-1].y, pts[i].x, pts[i].y)
end
for _, pt in ipairs(pts) do
if pt.draw then
for _,shape in ipairs(pt.draw) do
color(shape.r, shape.g, shape.b, shape.a)
if shape.type == 'circle' then
circle(shape.drawmode, shape.x, shape.y, shape.radius)
elseif shape.type == 'line' then
line(shape.x1, shape.y1, shape.x2, shape.y2)
end end end end
end
function car.draw()
for _, pts in ipairs(pts) do
draw_hilbert(pts)
end end
code
function h(x, y, xi, yi, xj, yj, n)
if n <= 0 then
local resultx, resulty = x+xi/2+xj/2, y+yi/2+yj/2
local x3, y3 = x+xi, y+yi
local x4, y4 = x+xj, y+yj
local debug = {
{type='circle', drawmode='fill', x=x, y=y, radius=2, r=1,g=0,b=0},
{type='line', x1=resultx, y1=resulty, x2=x, y2=y, r=1,g=0.5,b=0.5},
{type='circle', drawmode='line', x=x3, y=y3, radius=5, r=0, g=1, b=0},
{type='line', x1=resultx, y1=resulty, x2=x3, y2=y3, r=0.5,g=1,b=0.5},
{type='circle', drawmode='line', x=x4, y=y4, radius=5, r=0, g=1, b=0},
{type='line', x1=resultx, y1=resulty, x2=x4, y2=y4, r=0.5,g=1,b=0.5},
}
return {{x = resultx, y = resulty, draw=debug}}
end
return array_join(
h(x, y, xj/2, yj/2, xi/2, yi/2, n-1),
h(x+xi/2, y+yi/2, xi/2, yi/2, xj/2, yj/2, n-1),
h(x+xi/2+xj/2, y+yi/2+yj/2, xi/2, yi/2, xj/2, yj/2, n-1),
h(x+xi/2+xj, y+yi/2+yj, -xj/2, -yj/2, -xi/2, -yi/2, n-1))
end
function array_join(...)
local result = {}
for i, arg in ipairs{...} do
for _,x in ipairs(arg) do
table.insert(result, x)
end end
return result
end
function initialize_curves()
local pts = {}
local side = 80
local x, y = 60, 60
for n=1,4 do
table.insert(pts, h(x,y, side,0, 0,side, n))
x = x + side + 40
side = side*2
end
return pts
end
local pts = initialize_curves()
function draw_hilbert(pts)
color(0,0,1)
g.setLineWidth(2)
for i=2,#pts do
line(pts[i-1].x, pts[i-1].y, pts[i].x, pts[i].y)
end
for _, pt in ipairs(pts) do
if pt.draw then
for _,shape in ipairs(pt.draw) do
color(shape.r, shape.g, shape.b, shape.a)
if shape.type == 'circle' then
circle(shape.drawmode, shape.x, shape.y, shape.radius)
elseif shape.type == 'line' then
line(shape.x1, shape.y1, shape.x2, shape.y2)
end end end end
end
function car.draw()
for _, pts in ipairs(pts) do
draw_hilbert(pts)
end end
This is pretty. Every point can now contain a bag of debug data, commands to draw additional shapes. Since xi, yi, xj, yj are all distances not positions, I'm plotting (x+xi, y+yi) and (x+xj, y+yj), and it becomes obvious how the 3 points collaborate to form each point on the Hilbert curve. It becomes apparent that the control points are always oriented north-west to south-east, translating the base point (x, y) along a north-east to south-west orientation (the red lines).
But what's the pattern beyond that orientation? There's still more to dig here.
v6: Perhaps it would help to look at the scaffolding. Instead of showing me how the three points form the fourth, show me the “envelope” for each recursive call.
 code
local ox,oy = 300,100
local N = 800
local depth = 4
local primary = {r=1, g=0.8, b=0}
local control = {r=0, g=0.8, b=0.8}
local c = 0.8
local scaffold = {r=c, g=c, b=c}
function h(x, y, xi, yi, xj, yj, n, N)
if N == nil then N = n end
local x3, y3 = x+xi, y+yi
local x4, y4 = x+xj, y+yj
if n <= 0 then
local resultx, resulty = x+xi/2+yi/2, y+yi/2+yj/2
local debug = {
{type='circle', drawmode='fill', x=x, y=y, radius=5, color=primary},
{type='line', x1=resultx, y1=resulty, x2=x, y2=y, color=primary},
{type='circle', drawmode='line', x=x3, y=y3, radius=10, color=control},
{type='line', x1=resultx, y1=resulty, x2=x3, y2=y3, color=control},
{type='circle', drawmode='line', x=x4, y=y4, radius=10, color=control},
{type='line', x1=resultx, y1=resulty, x2=x4, y2=y4, color=control},
}
return {{x = resultx, y = resulty, draw=debug}}
end
local result = array_join(
h(x, y, xj/2, yj/2, xi/2, yi/2, n-1, N),
h(x+xi/2, y+yi/2, xi/2, yi/2, xj/2, yj/2, n-1, N),
h(x+xi/2+xj/2, y+yi/2+yj/2, xi/2, yi/2, xj/2, yj/2, n-1, N),
h(x+xi/2+xj, y+yi/2+yj, -xj/2, -yj/2, -xi/2, -yi/2, n-1, N))
if result[1].draw == nil then result[1].draw = {} end
result[1].draw = array_join(result[1].draw, {
{type='line', x1=x, y1=y, x2=x3, y2=y3, color=scaffold},
{type='line', x1=x, y1=y, x2=x4, y2=y4, color=scaffold},
})
return result
end
function car.draw()
local pts = h(0,0, N,0, 0,N, depth)
color(0,0,1)
love.graphics.setLineWidth(5)
for i=2,#pts do
line(ox+pts[i-1].x, oy+pts[i-1].y, ox+pts[i].x, oy+pts[i].y)
end
for _, pt in ipairs(pts) do
if pt.draw then
for _,shape in ipairs(pt.draw) do
color(shape.color.r, shape.color.g, shape.color.b, shape.color.a)
if shape.type == 'circle' then
love.graphics.setLineWidth(1)
circle(shape.drawmode, ox+shape.x, oy+shape.y, shape.radius)
elseif shape.type == 'line' then
love.graphics.setLineWidth(2)
line(ox+shape.x1, oy+shape.y1, ox+shape.x2, oy+shape.y2)
end end end end end
function array_join(...)
local result = {}
for i, arg in ipairs{...} do
for _,x in ipairs(arg) do
table.insert(result, x)
end end
return result
end
code
local ox,oy = 300,100
local N = 800
local depth = 4
local primary = {r=1, g=0.8, b=0}
local control = {r=0, g=0.8, b=0.8}
local c = 0.8
local scaffold = {r=c, g=c, b=c}
function h(x, y, xi, yi, xj, yj, n, N)
if N == nil then N = n end
local x3, y3 = x+xi, y+yi
local x4, y4 = x+xj, y+yj
if n <= 0 then
local resultx, resulty = x+xi/2+yi/2, y+yi/2+yj/2
local debug = {
{type='circle', drawmode='fill', x=x, y=y, radius=5, color=primary},
{type='line', x1=resultx, y1=resulty, x2=x, y2=y, color=primary},
{type='circle', drawmode='line', x=x3, y=y3, radius=10, color=control},
{type='line', x1=resultx, y1=resulty, x2=x3, y2=y3, color=control},
{type='circle', drawmode='line', x=x4, y=y4, radius=10, color=control},
{type='line', x1=resultx, y1=resulty, x2=x4, y2=y4, color=control},
}
return {{x = resultx, y = resulty, draw=debug}}
end
local result = array_join(
h(x, y, xj/2, yj/2, xi/2, yi/2, n-1, N),
h(x+xi/2, y+yi/2, xi/2, yi/2, xj/2, yj/2, n-1, N),
h(x+xi/2+xj/2, y+yi/2+yj/2, xi/2, yi/2, xj/2, yj/2, n-1, N),
h(x+xi/2+xj, y+yi/2+yj, -xj/2, -yj/2, -xi/2, -yi/2, n-1, N))
if result[1].draw == nil then result[1].draw = {} end
result[1].draw = array_join(result[1].draw, {
{type='line', x1=x, y1=y, x2=x3, y2=y3, color=scaffold},
{type='line', x1=x, y1=y, x2=x4, y2=y4, color=scaffold},
})
return result
end
function car.draw()
local pts = h(0,0, N,0, 0,N, depth)
color(0,0,1)
love.graphics.setLineWidth(5)
for i=2,#pts do
line(ox+pts[i-1].x, oy+pts[i-1].y, ox+pts[i].x, oy+pts[i].y)
end
for _, pt in ipairs(pts) do
if pt.draw then
for _,shape in ipairs(pt.draw) do
color(shape.color.r, shape.color.g, shape.color.b, shape.color.a)
if shape.type == 'circle' then
love.graphics.setLineWidth(1)
circle(shape.drawmode, ox+shape.x, oy+shape.y, shape.radius)
elseif shape.type == 'line' then
love.graphics.setLineWidth(2)
line(ox+shape.x1, oy+shape.y1, ox+shape.x2, oy+shape.y2)
end end end end end
function array_join(...)
local result = {}
for i, arg in ipairs{...} do
for _,x in ipairs(arg) do
table.insert(result, x)
end end
return result
end
No, that's pretty but too messy. The computation is partitioned but the image is full of overlapping points and lines (in spite of my efforts at using filled and hollow circles to show two things in one place). How can we reveal the overlaps? Maybe some animation?
Again, pretty. But too busy; I'm not sure I'm learning anything by staring at it.
At this point I'm starting to feel overwhelmed by the number of different versions of this program I've created. They're also competing for space with just the clean Hilbert curve, and I find myself commenting and uncommenting code to bounce between the curve and its internals. I realize I can create a dedicated space for debug UIs while also extracting a few common patterns of debug UIs that might be useful to other programs.
The dedicated space can be a goofy little window manager. But Carousel has its own eponymous metaphor for giving programs their own dedicated space/screen that you can navigate using buttons along the left and right margins even on the small screen of a phone. Let's give each debug UI its own screen. Programs write data for a specific UI under a special key in a table called `Windows`, and now debug UIs in other screens can render what they find there.
Some patterns start to come into focus:
- Text log. This is trivial and doesn't require its own screen. It's the starting point for generalization. I reached for it in v2 above.
- Replay-log. The program appends groups of shapes to a log, and they appear over time in the same order they were appended to the log. In effect, we're showing time as time, just offset, a recording with adjustable speed. This is akin to v3 above. code (150 lines) run_screen('ticks') run_screen('widgets') function debug_window_replay_log(window_name, speeds) local I = {} if Windows == nil then Windows = {} end if Windows.__viewport == nil then Windows.__viewport = {} end if Windows[window_name] == nil then Windows[window_name] = {} end if Windows.__viewport[window_name] == nil then run_screen('infinite-viewport') Windows.__viewport[window_name] = run_screen_return run_screen_return = nil end local v = Windows.__viewport[window_name] local frame_index = 0 local speed_index = 1 for i,speed in ipairs(speeds) do if speed == 1 then speed_index = i end end function car.draw() local title = ('%d/%d'):format(frame_index, #Windows[window_name]) love.graphics.print(title, 100, Menu_bottom + 15) I.draw_axes() assert(frame_index < #Windows[window_name]+1) for i=1,frame_index do local shape_batch = Windows[window_name][i] I.draw_shapes(shape_batch) end love.graphics.setColor(0.5,0.5,0.5) love.graphics.print('replay speed (shapes/s)', 50, 250-9*20) widgets.__draw() I.draw_hud() end function I.draw_shapes(batch) for i,shape in ipairs(batch) do I.draw_shape(shape) end end function I.draw_shape(shape) color(shape.r or 0.5, shape.g or 0.5, shape.b or 0.5, shape.a or 1) if shape.type == 'point' then circle('fill', v.vx(shape.x), v.vy(shape.y), 2) elseif shape.type == 'line' then line(v.vx(shape.x1), v.vy(shape.y1), v.vx(shape.x2), v.vy(shape.y2)) elseif shape.type == 'rectangle' then rect(shape.drawmode or 'fill', v.vx(shape.x), v.vy(shape.y), v.scale(shape.w), v.scale(shape.h)) elseif shape.type == 'circle' then circle(shape.drawmode or 'fill', v.vx(shape.x), v.vy(shape.y), v.scale(shape.radius)) elseif shape.type == 'text' then g.print(shape.data, v.vx(shape.x), v.vy(shape.y)) elseif shape.type == 'group' then I.draw_shapes(shape) end end function I.speed_indicator(index) local drawmode, x,y, w,h local function refresh() drawmode = 'line' x, w,h = 80, 10, 20 if speed_index >= index then drawmode = 'fill' x, w = x-1, w+2 end y = Menu_bottom + 100 + #speeds*h - index*h end refresh() local draw = function() refresh() love.graphics.setColor(1,0,1) love.graphics.rectangle(drawmode, x,y, w, h) love.graphics.line(x+w, y, x+w+5, y) love.graphics.setColor(0.5,0.5,0.5) love.graphics.print(speeds[index], x+w+10, y-10) end local ispress = function(x2,y2) return x <= x2 and x2 <= x+w and y <= y2 and y2 <= y+h end local press = function() speed_index = index return true end return {draw=draw, ispress=ispress, press=press} end for i=1,#speeds do widgets['speed_indicator_'..i] = I.speed_indicator(i) end function car.update(dt) widgets.__update(dt) frame_index = frame_index + dt*speeds[speed_index] if frame_index >= #Windows[window_name] + 1 then frame_index = 0 elseif frame_index < 0 then frame_index = #Windows[window_name] end end function I.draw_axes() color(0.5,0.5,0.5) line(0, v.vy(0), Safe_width, v.vy(0)) line(v.vx(0), 0, v.vx(0), Safe_height) if ticks == nil then return end local xlo, xhi = ticks(v.sx(0), v.sx(Safe_width)) for i=0,10 do local x = xlo+i/10*(xhi-xlo) local vx, vy = v.vx(x), v.vy(0) line(vx, vy, vx, vy+5) g.print(x, vx-10, vy+10) end local ylo, yhi = ticks(v.sy(Menu_bottom), v.sy(Safe_height)) for i=0,10 do local y = ylo+i/10*(yhi-ylo) local vx, vy = v.vx(0), v.vy(y) line(vx, vy, vx+5, vy) g.print(y, vx+10, vy+5) end end function I.draw_hud() color(0.5, 0.5, 0.5) for _,id in ipairs(touches()) do local x, y = touch(id) circle('fill', x, y, 10) end end car.mouse_press = v.mouse_press car.mouse_move = v.mouse_move car.mouse_release = v.mouse_release car.mouse_wheel_move = v.mouse_wheel_move function car.touch_press(id, x,y, ...) if widgets.__press(x,y, id) then return end v.touch_press(id, x,y, ...) end car.touch_move = v.touch_move function car.touch_release(id, x,y, ...) if widgets.__release(x,y, id) then return end v.touch_release(id, x,y, ...) end end debug_window_replay_log('replay', {-10, -4, -2, -1, -0.5, -0.25, -0.1, 0, 0.1, 0.25, 0.5, 1, 2, 4, 10})
- Draw shapes on a surface without any further structure, and always draw them all. v4 and v5 demonstrated this, but we can also support panning and zooming on the surface with multitouch support. code (85 lines) run_screen('ticks') function debug_window_surface(window_name) local I = {} if Windows == nil then Windows = {} end if Windows.__viewport == nil then Windows.__viewport = {} end if Windows[window_name] == nil then Windows[window_name] = {} end if Windows.__viewport[window_name] == nil then run_screen('infinite-viewport') Windows.__viewport[window_name] = run_screen_return run_screen_return = nil end local v = Windows.__viewport[window_name] function car.draw() I.draw_axes() for _,shape in ipairs(Windows[window_name]) do I.draw_shape(shape) end I.draw_hud() end function I.draw_shape(shape) color(shape.r or 0.5, shape.g or 0.5, shape.b or 0.5, shape.a or 1) if shape.type == 'point' then circle('fill', v.vx(shape.x), v.vy(shape.y), 2) elseif shape.type == 'line' then line(v.vx(shape.x1), v.vy(shape.y1), v.vx(shape.x2), v.vy(shape.y2)) elseif shape.type == 'rectangle' then rect(shape.drawmode or 'fill', v.vx(shape.x), v.vy(shape.y), v.scale(shape.w), v.scale(shape.h)) elseif shape.type == 'circle' then circle(shape.drawmode or 'fill', v.vx(shape.x), v.vy(shape.y), v.scale(shape.radius)) elseif shape.type == 'text' then g.print(shape.data, v.vx(shape.x), v.vy(shape.y)) elseif shape.type == 'group' then I.draw_shapes(shape) end end function I.draw_axes() color(0.5,0.5,0.5) line(0, v.vy(0), Safe_width, v.vy(0)) line(v.vx(0), 0, v.vx(0), Safe_height) if ticks == nil then return end local xlo, xhi = ticks(v.sx(0), v.sx(Safe_width)) for i=0,10 do local x = xlo+i/10*(xhi-xlo) local vx, vy = v.vx(x), v.vy(0) line(vx, vy, vx, vy+5) g.print(x, vx-10, vy+10) end local ylo, yhi = ticks(v.sy(Menu_bottom), v.sy(Safe_height)) for i=0,10 do local y = ylo+i/10*(yhi-ylo) local vx, vy = v.vx(0), v.vy(y) line(vx, vy, vx+5, vy) g.print(y, vx+10, vy+5) end end function I.draw_hud() color(0.5, 0.5, 0.5) for _,id in ipairs(touches()) do local x, y = touch(id) circle('fill', x, y, 10) end end car.mouse_press = v.mouse_press car.mouse_move = v.mouse_move car.mouse_release = v.mouse_release car.mouse_wheel_move = v.mouse_wheel_move car.touch_press = v.touch_press car.touch_move = v.touch_move car.touch_release = v.touch_release end debug_window_surface('surface')
- A graphical log. Show time on the y-axis. It didn't help much here, but you can see it in action on a different program. code (80 lines) function debug_window_plot_log(window_name, ox,oy, w,h) local I = {} if Windows == nil then Windows = {} end if Windows.__viewport == nil then Windows.__viewport = {} end if Windows[window_name] == nil then Windows[window_name] = {} end if Windows.__viewport[window_name] == nil then run_screen('infinite-viewport') Windows.__viewport[window_name] = run_screen_return run_screen_return = nil end local v = Windows.__viewport[window_name] function car.draw() local x0,y0 = 0,0 for _,batch in ipairs(Windows[window_name]) do I.draw_shapes(batch, x0,y0) y0 = y0 + h + 50 end I.draw_hud() end function I.draw_shapes(batch, x0,y0) color(0.5,0.5,0.5) line(v.vx(x0), v.vy(y0-oy), v.vx(x0+w), v.vy(y0-oy)) line(v.vx(x0-ox), v.vy(y0+0), v.vx(x0-ox), v.vy(y0+h)) for _,shape in ipairs(batch) do I.draw_shape(shape, x0-ox,y0-oy) end end function I.draw_shape(shape, x0,y0) color(shape.r or 0.5, shape.g or 0.5, shape.b or 0.5, shape.a or 1) if shape.type == 'point' then circle('fill', v.vx(x0+shape.x), v.vy(y0+shape.y), 2) elseif shape.type == 'line' then line(v.vx(x0+shape.x1), v.vy(y0+shape.y1), v.vx(x0+shape.x2), v.vy(y0+shape.y2)) elseif shape.type == 'rectangle' then rect(shape.drawmode or 'fill', v.vx(x0+shape.x), v.vy(y0+shape.y), v.scale(shape.w), v.scale(shape.h)) elseif shape.type == 'circle' then circle(shape.drawmode or 'fill', v.vx(x0+shape.x), v.vy(y0+shape.y), v.scale(shape.radius)) elseif shape.type == 'text' then g.print(shape.data, v.vx(x0+shape.x), v.vy(y0+shape.y)) elseif shape.type == 'group' then I.draw_shapes(shape, x0,y0) end end function I.draw_hud() color(0.5, 0.5, 0.5) for _,id in ipairs(touches()) do local x, y = touch(id) circle('fill', x, y, 10) end end function car.keychord_press(chord) if chord == 'down' then v.v.y = v.v.y + h + 50 elseif chord == 'up' then if v.v.y > 0 then v.v.y = v.v.y - h - 50 end end end car.mouse_press = v.mouse_press car.mouse_move = v.mouse_move car.mouse_release = v.mouse_release car.mouse_wheel_move = v.mouse_wheel_move car.touch_press = v.touch_press car.touch_move = v.touch_move car.touch_release = v.touch_release end debug_window_plot_log('log', 0, 0, 500,500)
- Exploding view drawings give me a way to overlay and decompose sub-computations.
code (200 lines)
function debug_window_explode(window_name, w,h)
local I = {}
if Windows == nil then Windows = {} end
if Windows.__viewport == nil then Windows.__viewport = {} end
if Windows[window_name] == nil then Windows[window_name] = {} end
if Windows.__viewport[window_name] == nil then
run_screen('infinite-viewport')
Windows.__viewport[window_name] = run_screen_return
run_screen_return = nil
local v = Windows.__viewport[window_name]
v.x, v.y = -5, -5*Safe_height/Safe_width
v.w, v.h = -2*v.x, -2*v.y
v.zoom = Safe_width/v.w
end
local v = Windows.__viewport[window_name]
local layout = {}
local pad = 500
function I.adjacent_options(r, r2)
return {
{x=r2.x - r.w - pad, y=r2.y, w=r.w, h=r.h},
{x=r2.x+r2.w+pad, y=r2.y, w=r.w, h=r.h},
{x=r2.x, y=r2.y - r.h - pad, w=r.w, h=r.h},
{x=r2.x, y=r2.y+r2.h+pad, w=r.w, h=r.h},
}
end
function I.place(r, rs)
for i, r2 in ipairs(rs) do
local options = I.adjacent_options(r, r2)
for _, r1 in ipairs(options) do
if not I.aabb_any(r1, rs) then return r1 end
end
end
return r
end
function I.aabb_any(r, rs)
for _, r2 in ipairs(rs) do
if I.aabb(r, r2) then return true end
end
end
function I.aabb(r1, r2)
return r1.x < r2.x+r2.w+pad
and r1.x+r1.w+pad > r2.x
and r1.y < r2.y+r2.h+pad
and r1.y+r1.h+pad > r2.y
end
function I.place_near(r, cands, rs)
for i, r2 in ipairs(cands) do
local options = I.adjacent_options(r, r2)
for j, r1 in ipairs(options) do
if not I.aabb_any(r1, rs) then return r1 end
end
end
assert(false)
end
function I.place_batch(batch)
batch.w, batch.h = w, h
local pos = I.place(batch, layout)
pos.data = batch
table.insert(layout, pos)
end
function I.place_batch_near(batch, cands)
batch.w, batch.h = w, h
local pos = I.place_near(batch, cands, layout)
pos.data = batch
table.insert(layout, pos)
return pos
end
function I.place_lower_batches(batch)
for _, b in ipairs(batch) do
if #b > 0 then
I.place_batch(b)
end
end
for _, b in ipairs(batch) do
if b.type == 'group' then
I.place_lower_batches(b)
end
end end
function I.title(msg)
return {type='text', data=msg, x=50, y=-10000}
end
function I.handle_layout_touch(x,y)
local sx,sy = v.sx(x), v.sy(y)
for i,batch in ipairs(layout) do
if I.within_rect(batch, sx,sy) then
if batch.expanded then return end
batch.expanded = true
local cands = {batch}
for j, b in ipairs(batch.data) do
if b.type == 'group' and #b > 0 then
local pos = I.place_batch_near(b, cands)
table.insert(cands, pos)
end
end
return true
end end end
function I.within_rect(rect, x,y)
return rect.x <= x and x <= rect.x+rect.w
and rect.y <= y and y <= rect.y+rect.h
end
function I.collapse_all(batch)
batch.expanded = nil
for _, b in ipairs(batch) do
if b.type == 'group' then
I.collapse_all(b)
end end end
local save_data
function car.update(dt)
if #Windows[window_name] == 0 then return end
if save_data == Windows[window_name][1] then return end
layout = {}
save_data = Windows[window_name][1]
save_data.x, save_data.y = 0, 0
I.collapse_all(save_data)
I.place_batch(save_data)
end
function car.draw()
for _, batch in ipairs(layout) do
I.draw_batch(batch.data, batch.x, batch.y)
end
I.draw_hud()
end
function I.draw_batch(batch, x0,y0)
color(0.5,0.5,0.5)
line(v.vx(x0), v.vy(y0+0), v.vx(x0+w), v.vy(y0+0))
line(v.vx(x0+0), v.vy(y0), v.vx(x0+0), v.vy(y0+h))
I.draw_shapes(batch, x0,y0, true)
end
function I.draw_shapes(batch, x0,y0, top)
for _,shape in ipairs(batch) do
if top or not shape.at_top then
I.draw_shape(shape, x0,y0)
end end end
function I.draw_shape(shape, x0,y0)
color(shape.r or 0.5, shape.g or 0.5, shape.b or 0.5, shape.a or 1)
if shape.type == 'point' then
circle('fill', v.vx(x0+shape.x), v.vy(y0+shape.y), 2)
elseif shape.type == 'line' then
if shape.name then print(shape.name) end
line(v.vx(x0+shape.x1), v.vy(y0+shape.y1), v.vx(x0+shape.x2), v.vy(y0+shape.y2))
elseif shape.type == 'rectangle' then
rect(shape.drawmode or 'fill', v.vx(x0+shape.x), v.vy(y0+shape.y),
v.scale(shape.w), v.scale(shape.h))
elseif shape.type == 'circle' then
circle(shape.drawmode or 'fill', v.vx(x0+shape.x), v.vy(y0+shape.y), v.scale(shape.radius))
elseif shape.type == 'text' then
g.print(shape.data, v.vx(x0+shape.x), v.vy(y0+shape.y))
elseif shape.type == 'group' then
I.draw_shapes(shape, x0,y0)
end end
function I.draw_hud()
color(0.5, 0.5, 0.5)
for _,id in ipairs(touches()) do
local x, y = touch(id)
circle('fill', x, y, 10)
end
end
car.mouse_press = v.mouse_press
car.mouse_move = v.mouse_move
car.mouse_release = v.mouse_release
car.mouse_wheel_move = v.mouse_wheel_move
function car.touch_press(id, x,y, ...)
if I.handle_layout_touch(x,y) then return end
v.touch_press(id, x,y, ...)
end
car.touch_move = v.touch_move
car.touch_release = v.touch_release
end
debug_window_explode('nested', 500,500)
Generating data for the exploding view function h(x, y, xi, yi, xj, yj, n, log, points_so_far) log.type = 'group' local p = points_so_far if #p > 0 then for i=2,#p do table.insert(log, {type='line', x1=p[i-1].x, y1=p[i-1].y, x2=p[i].x, y2=p[i].y, r=0, g=0, b=0.8, at_top = true, }) end end if n <= 0 then local resultx, resulty = x+xi/2+yi/2, y+yi/2+yj/2 if p and #p > 0 then table.insert(log, {type='line', x1=p[#p].x, y1=p[#p].y, x2=resultx, y2=resulty, r=0.5, g=0.5, b=0.5, }) end local x3, y3 = x+xi, y+yi local x4, y4 = x+xj, y+yj insert_all(log, {type='circle', drawmode='fill', x=x, y=y, radius=2, r=1,g=0.8,b=0}, {type='line', x1=resultx, y1=resulty, x2=x, y2=y, r=1,g=0.8,b=0}, {type='circle', drawmode='line', x=x3, y=y3, radius=5, r=0, g=1, b=1}, {type='line', x1=resultx, y1=resulty, x2=x3, y2=y3, r=0.5,g=1,b=1}, {type='circle', drawmode='line', x=x4, y=y4, radius=5, r=0, g=1, b=1}, {type='line', x1=resultx, y1=resulty, x2=x4, y2=y4, r=0.5,g=1,b=1}, {type='point', x=resultx, y=resulty,r=1,g=0,b=0} ) return {{x = resultx, y = resulty, draw=debug}} end local points_so_far_at_start = points_so_far local log1, log2, log3, log4 = {}, {}, {}, {} local res1 = h(x, y, xj/2, yj/2, xi/2, yi/2, n-1, log1, points_so_far) points_so_far = array_join(points_so_far, res1) local res2 = h(x+xi/2, y+yi/2, xi/2, yi/2, xj/2, yj/2, n-1, log2, points_so_far) points_so_far = array_join(points_so_far, res2) local res3 = h(x+xi/2+xj/2, y+yi/2+yj/2, xi/2, yi/2, xj/2, yj/2, n-1, log3, points_so_far) points_so_far = array_join(points_so_far, res3) local res4 = h(x+xi/2+xj, y+yi/2+yj, -xj/2, -yj/2, -xi/2, -yi/2, n-1, log4, points_so_far) insert_all(log, log1, log2, log3, log4) local result = array_join(res1, res2, res3, res4) if #points_so_far_at_start > 0 then local p = points_so_far_at_start table.insert(log, {type='line', x1=p[#p].x, y1=p[#p].y, x2=result[1].x, y2=result[1].y, r=0.5, g=0.5, b=0.5, at_top=true, }) end local p = result for i=2,#p do table.insert(log, {type='line', x1=p[i-1].x, y1=p[i-1].y, x2=p[i].x, y2=p[i].y, r=0.5, g=0.5, b=0.5, at_top=true, }) end append(points_so_far, result) return result end function insert_all(h, ...) local args = {...} for _, arg in ipairs(args) do table.insert(h, arg) end end function append(r, r1) for _,x in ipairs(r1) do table.insert(r, x) end end function array_join(...) local result = {} for i, arg in ipairs{...} do for _,x in ipairs(arg) do table.insert(result, x) end end return result end function dbg(window_name, data) table.insert(Windows[window_name], data) end if Windows == nil then Windows = {} end Windows.surface = {} Windows.log = {} local log = {} local pts = h(60, 60, 400, 0, 0, 400, 2, log, {}) Windows.nested = {log} local ox,oy = 200,200 function car.draw() color(0,0,0) for i=2,#pts do line(ox+pts[i-1].x, oy+pts[i-1].y, ox+pts[i].x, oy+pts[i].y) end end
They require a little more thought to use. Every call creates a group of shapes, and the groups created by recursive calls become children of their caller. Groups can thus contain more groups, to arbitrary depth. A group draws everything under it when collapsed, and expanding a group corresponds to giving its child groups their own disjoint space on the surface.
- Replay. After working through these options I think of another pattern. What I need is to be able to animate things, but in a different order than I computed them. Made-up time. Show higher levels together, pretend the computation was breadth-first.
code (150 lines)
run_screen('ticks')
run_screen('widgets')
function debug_window_replay(window_name, speeds)
local I = {}
if Windows == nil then Windows = {} end
if Windows.__viewport == nil then Windows.__viewport = {} end
if Windows[window_name] == nil then Windows[window_name] = {} end
if Windows.__viewport[window_name] == nil then
run_screen('infinite-viewport')
Windows.__viewport[window_name] = run_screen_return
run_screen_return = nil
end
local v = Windows.__viewport[window_name]
local frame_index = 0
local speed_index = 1
for i,speed in ipairs(speeds) do
if speed == 1 then speed_index = i end
end
function car.draw()
local title = ('%d/%d'):format(frame_index, #Windows[window_name])
love.graphics.print(title, 100, Menu_bottom + 15)
I.draw_axes()
local f = floor(frame_index)
assert(f <= #Windows[window_name])
I.draw_shapes(Windows[window_name][f])
love.graphics.setColor(0.5,0.5,0.5)
love.graphics.print('replay speed (shapes/s)', 50, 250-9*20)
widgets.__draw()
I.draw_hud()
end
function I.draw_shapes(batch)
if batch == nil then return end
for i,shape in ipairs(batch) do
I.draw_shape(shape)
end
end
function I.draw_shape(shape)
color(shape.r or 0.5, shape.g or 0.5, shape.b or 0.5, shape.a or 1)
if shape.type == 'point' then
circle('fill', v.vx(shape.x), v.vy(shape.y), 2)
elseif shape.type == 'line' then
line(v.vx(shape.x1), v.vy(shape.y1), v.vx(shape.x2), v.vy(shape.y2))
elseif shape.type == 'rectangle' then
rect(shape.drawmode or 'fill', v.vx(shape.x), v.vy(shape.y), v.scale(shape.w), v.scale(shape.h))
elseif shape.type == 'circle' then
circle(shape.drawmode or 'fill', v.vx(shape.x), v.vy(shape.y), v.scale(shape.radius))
elseif shape.type == 'text' then
g.print(shape.data, v.vx(shape.x), v.vy(shape.y))
elseif shape.type == 'group' then
I.draw_shapes(shape)
end end
function I.speed_indicator(index)
local drawmode, x,y, w,h
local function refresh()
drawmode = 'line'
x, w,h = 80, 10, 20
if speed_index >= index then
drawmode = 'fill'
x, w = x-1, w+2
end
y = Menu_bottom + 100 + #speeds*h - index*h
end
refresh()
local draw = function()
refresh()
love.graphics.setColor(1,0,1)
love.graphics.rectangle(drawmode, x,y, w, h)
love.graphics.line(x+w, y, x+w+5, y)
love.graphics.setColor(0.5,0.5,0.5)
love.graphics.print(speeds[index], x+w+10, y-10)
end
local ispress = function(x2,y2)
return x <= x2 and x2 <= x+w and y <= y2 and y2 <= y+h
end
local press = function() speed_index = index return true end
return {draw=draw, ispress=ispress, press=press}
end
for i=1,#speeds do
widgets['speed_indicator_'..i] = I.speed_indicator(i)
end
function car.update(dt)
widgets.__update(dt)
frame_index = frame_index + dt*speeds[speed_index]
if frame_index >= #Windows[window_name] + 1 then
frame_index = 0
elseif frame_index < 0 then
frame_index = #Windows[window_name]
end
end
function I.draw_axes()
color(0.5,0.5,0.5)
line(0, v.vy(0), Safe_width, v.vy(0))
line(v.vx(0), 0, v.vx(0), Safe_height)
if ticks == nil then return end
local xlo, xhi = ticks(v.sx(0), v.sx(Safe_width))
for i=0,10 do
local x = xlo+i/10*(xhi-xlo)
local vx, vy = v.vx(x), v.vy(0)
line(vx, vy, vx, vy+5)
g.print(x, vx-10, vy+10)
end
local ylo, yhi = ticks(v.sy(Menu_bottom), v.sy(Safe_height))
for i=0,10 do
local y = ylo+i/10*(yhi-ylo)
local vx, vy = v.vx(0), v.vy(y)
line(vx, vy, vx+5, vy)
g.print(y, vx+10, vy+5)
end
end
function I.draw_hud()
color(0.5, 0.5, 0.5)
for _,id in ipairs(touches()) do
local x, y = touch(id)
circle('fill', x, y, 10)
end
end
car.mouse_press = v.mouse_press
car.mouse_move = v.mouse_move
car.mouse_release = v.mouse_release
car.mouse_wheel_move = v.mouse_wheel_move
function car.touch_press(id, x,y, ...)
if widgets.__press(x,y, id) then return end
v.touch_press(id, x,y, ...)
end
car.touch_move = v.touch_move
function car.touch_release(id, x,y, ...)
if widgets.__release(x,y, id) then return end
v.touch_release(id, x,y, ...)
end
end
debug_window_replay('replay', {-10, -4, -2, -1, -0.5, -0.25, -0.1, 0, 0.1, 0.25, 0.5, 1, 2, 4, 10})
Visualize all calls at the same depth in the same frame of the replay animation. if then Windows = {} end if == nil then Windows.replay = {} end function h(x, y, xi, yi, xj, yj, n, depth) if depth == nil then depth = 1 end if Windows.replay[depth] == nil then Windows.replay[depth] = {type='group'} end local r = 5 table.insert(Windows.replay[depth], {type='group', {type='circle', drawmode='fill', x=x, y=y, radius=r}, {type='circle', drawmode='line', x=x+xi, y=y+yi, radius=r}, {type='circle', drawmode='line', x=x+xj, y=y+yj, radius=r}, {type='line', x1=x, y1=y, x2=x+xi, y2=y+yi}, {type='line', x1=x, y1=y, x2=x+xj, y2=y+yj}, }) if n <= 0 then return {x+xi/2+xj/2, y+yi/2+yj/2} end return array_join( h(x, y, xj/2, yj/2, xi/2, yi/2, n-1, depth+1), h(x+xi/2, y+yi/2, xi/2, yi/2, xj/2, yj/2, n-1, depth+1), h(x+xi/2+xj/2, y+yi/2+yj/2, xi/2, yi/2, xj/2, yj/2, n-1, depth+1), h(x+xi/2+xj, y+yi/2+yj, -xj/2, -yj/2, -xi/2, -yi/2, n-1, depth+1)) end function array_join(...) local result = {} for i, arg in ipairs{...} do for _,x in ipairs(arg) do table.insert(result, x) end end return result end if Windows == nil then Windows = {} end Windows.replay = {} local pts = h(60, 60, 800, 0, 0, 800, --[[n]] 2) function car.draw() color(0,0,0) line(unpack(pts)) end
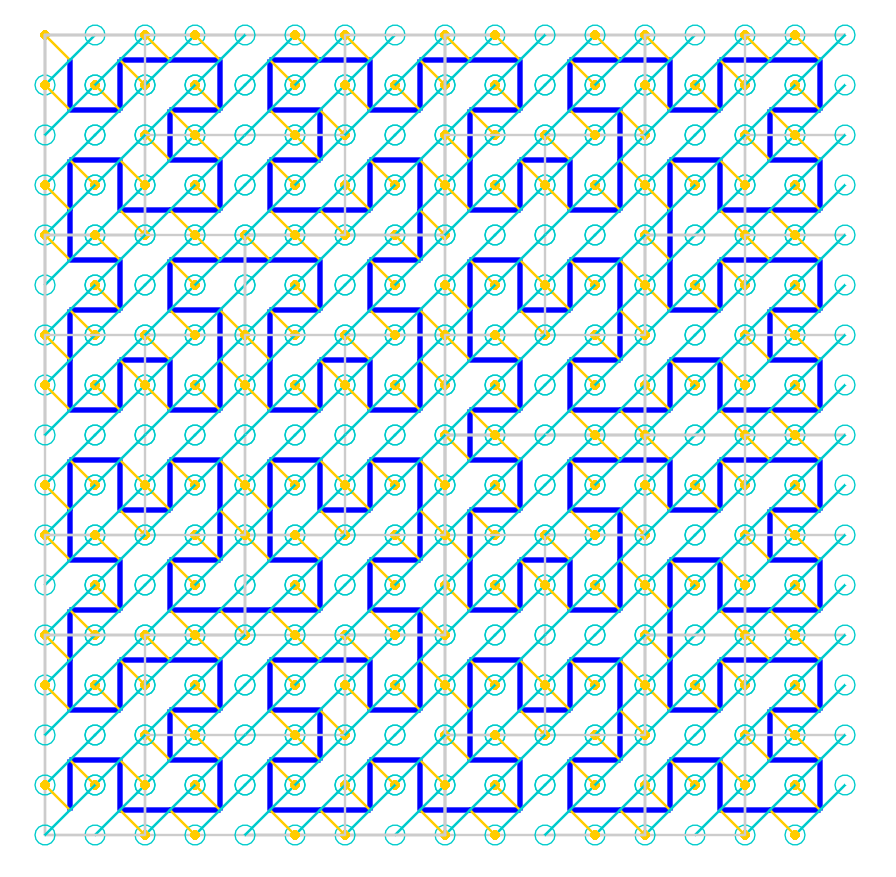
Add some color and offset the lines to separate them visually:
the minor code changes made if Windows == nil then Windows = {} end if Windows.replay == nil then Windows.replay = {} end function h(x, y, xi, yi, xj, yj, n, depth) if depth == nil then depth = 1 end if Windows.replay[depth] == nil then Windows.replay[depth] = {type='group'} end local r = 5 local x1,y1, x2,y2, x3,y3 x1 = x+xi/10+xj/10 y1 = y+yi/10+yj/10 if xi == 0 then x2 = x + xj/10 y2 = y + yi*9/10 else x2 = x + xi*9/10 y2 = y + yj/10 end if xj == 0 then x3 = x + xi/10 y3 = y + yj*9/10 else x3 = x + xj*9/10 y3 = y + yi/10 end table.insert(Windows.replay[depth], {type='group', {type='circle', drawmode='fill', x=x1, y=y1, radius=r, r=1,g=0.8,b=0}, {type='line', x1=x1, y1=y1, x2=x2, y2=y2, r=0, g=1, b=1}, {type='line', x1=x1, y1=y1, x2=x3, y2=y3, r=1, g=0, b=1}, }) if n <= 0 then return {x+xi/2+xj/2, y+yi/2+yj/2} end return array_join( h(x, y, xj/2, yj/2, xi/2, yi/2, n-1, depth+1), h(x+xi/2, y+yi/2, xi/2, yi/2, xj/2, yj/2, n-1, depth+1), h(x+xi/2+xj/2, y+yi/2+yj/2, xi/2, yi/2, xj/2, yj/2, n-1, depth+1), h(x+xi/2+xj, y+yi/2+yj, -xj/2, -yj/2, -xi/2, -yi/2, n-1, depth+1)) end function array_join(...) local result = {} for i, arg in ipairs{...} do for _,x in ipairs(arg) do table.insert(result, x) end end return result end if Windows == nil then Windows = {} end Windows.replay = {} local pts = h(60, 60, 800, 0, 0, 800, --[[n]] 2) function car.draw() color(0,0,0) line(unpack(pts)) end
I stare at this last one a while.
A small insight arrives. To draw a hilbert curve you need only to answer this question:
Given a square divided into 4 quadrants, in what order should the quadrants be visited to efficiently fill the space?An answer to this question gives you the Hilbert curve as you subdivide quadrants. Given a sequence of quadrants at the finest level, the Hilbert curve simply connects up their centroids.
And the image above gives the answer to this question. The magenta line (bearing: xj,yj) shows for each square the quadrants where the start and end point lie. And the cyan line (bearing: xi,yi) indicates the direction of the remaining 2 quadrants, the direction the curve must head out to before returning to the magenta line.
The job of a debug UI is done when it forms a picture in my mind. However, for a blog post I'll clearly draw out the picture in my mind:
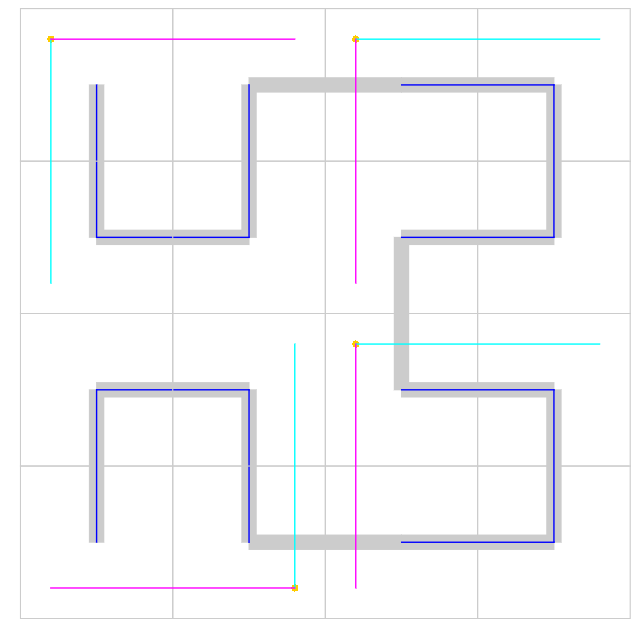
The Hilbert curve always starts at the (center of the) quadrant containing the corner of the magenta and cyan lines (quadrant x,y), continues along the cyan direction (bearing xi,yi) and then turns in the magenta direction (bearing xj,yj) before returning to the magenta quadrants. Convince yourself this is true in the above image!
Perhaps this is obvious to you. Perhaps it was hard for me to get to because I was thinking in terms of lines, conditioned by my starting point with L-systems. I didn't attend enough to the quadrants.
Perhaps you're still mystified. Perhaps it just took me a while to get used to it all, and gain some illusion of understanding. Perhaps I'd have gotten there with one of the earlier visualizations, if I just stared at it a while. It's certainly true that it's been a slow, soaking understanding rather than a flash of insight. Attributing an outcome to a single cause is always a fraught exercise.
I'm going to keep using these patterns of debug UIs. Hopefully I won't encounter too many more such patterns before completing a basis set for all seasons.
fine print
Some of the debug UIs above require a couple of additional screens of code: widgets contains a simple pattern for creating UI elements (45 lines) -- helper screen for creating UI widgets on screen widgets = {} -- global; clear stuff from any previous windows -- still ugly, though; you'll see cruft when you switch screens. TODO long_press_duration = 1 function widgets.__draw() for name,w in pairs(widgets) do if type(name) ~= 'string' or name:find('__') == nil and w.draw then w.draw() end end end function widgets.__press(x,y, b) for name,w in pairs(widgets) do if type(name) ~= 'string' or name:find('__') == nil then if w.ispress and w.ispress(x,y) and w.press then return w.press() end end end end function widgets.__update(dt) local x, y = App.mouse_x(), App.mouse_y() local mouse_down = App.mouse_down(1) for name,w in pairs(widgets) do if name:find('__') == nil then if w.update then w.update(dt, x,y) end if w.long_press then if mouse_down and w.ispress(x,y) then if w.press_time == nil then w.press_time = 0 else w.press_time = w.press_time+dt if w.press_time > long_press_duration then w.long_press() w.press_time = nil end end else w.press_time = nil end end end end end function widgets.__release(x,y, b) for name,w in pairs(widgets) do if type(name) ~= 'string' or name:find('__') == nil then if w.ispress and w.ispress(x,y) and w.release then return w.release() end end end end ticks decides where to show ticks on the x- and y-axis based on the current viewport (40 lines) function ticks(lo, hi) local om = order_of_magnitude(hi-lo) return approximate(lo, om), approximate_up(hi, om) end function order_of_magnitude(n) return floor(math.log(abs(n))/math.log(10)) end function approximate(n, zeros) -- turn n into a number with n zeros if zeros >= 0 then for i=1,zeros do n = n/10 end else for i=zeros,0 do n = n*10 end end n = floor(n) if zeros >= 0 then for i=1,zeros do n = n*10 end else for i=zeros,0 do n = n/10 end end return n end function approximate_up(n, zeros) -- turn n into a number with n zeros if zeros >= 0 then for i=1,zeros do n = n/10 end else for i=zeros,0 do n = n*10 end end n = ceil(n) if n == 0 then n = 1 end if zeros >= 0 then for i=1,zeros do n = n*10 end else for i=zeros,0 do n = n/10 end end return n end infinite-viewport implements pan and zoom gestures for mouse and multitouch screen (120 lines) -- run this screen to get an infinite viewport with mouse/touch handlers for panning/zooming -- TODO: how to allow screens to use this while also tweaking the mouse handler for themselves? local M = {} -- interface of methods that can be used to draw to the surface local I = {} -- internals -- initialize viewport with origin at center M.v = {x=-5, y=-5*Safe_height/Safe_width} M.v.w = -2*M.v.x M.v.h = -2*M.v.y M.v.zoom = Safe_width/M.v.w local v = M.v local f,s = nil -- ids of first and second touches local start, curr = {}, {} -- coords of touches local initzoom = nil local initzoompos = nil -- for zooming using mouse wheel, in viewport coordinates local initpos = nil -- for panning, in surface coordinates -- handle mouse and touch the same way function M.mouse_press(x,y, b) car.touch_press('mouse', x,y) end M.mousepressed = M.mouse_press function M.mouse_move(x,y) car.touch_move('mouse', x,y) end M.mousemoved = M.mouse_move function M.mouse_release(x,y, b) car.touch_release('mouse', x,y) end M.mousereleased = M.mouse_release function M.touch_press(id, x,y, ...) if f == 'mouse' then -- redo f, s, start.mouse, curr.mouse = nil end if f == nil then f = id initpos = {x=v.x, y=v.y} else s = id initzoom = v.zoom end start[id] = {x=x, y=y} curr[id] = {x=x, y=y} end M.touchpressed = M.touch_press function M.touch_release(id, x,y, ...) f,s = nil start, curr = {}, {} initzoom, initzoompos, initpos = nil end M.touchreleased = M.touch_release function M.touch_move(id, x,y, ...) initzoompos = nil -- assume mouse wheel never moves the mouse, mouse moving is between uses of the wheel if start[id] then curr[id] = {x=x, y=y} if s then local oldzoom = v.zoom v.zoom = dist(curr[f], curr[s])/dist(start[f], start[s])*initzoom I.adjust_viewport(oldzoom, v.zoom) elseif f then v.x = initpos.x + M.iscale(start[f].x - x) v.y = initpos.y + M.iscale(start[f].y - y) end end end M.touchmoved = M.touch_move -- on a computer use the mouse wheel to zoom and pan function M.mouse_wheel_move(dx,dy) local keydown = love.keyboard.isDown if keydown('lctrl') or keydown('rctrl') then if initzoompos == nil then local mx,my = love.mouse.getPosition() initzoompos = {x=mx, y=my} end local sx, sy = M.sx(initzoompos.x), M.sy(initzoompos.y) v.zoom = (1+dy/10)*v.zoom v.x = sx - M.iscale(initzoompos.x) v.y = sy - M.iscale(initzoompos.y) local sx2,sy2 = M.sx(initzoompos.x), M.sy(initzoompos.y) else v.x = v.x + v.w/10*dx v.y = v.y - v.h/10*dy end end M.wheelmoved = M.mouse_wheel_move function I.adjust_viewport(oldzoom, zoom) -- ensure centroid of fingers remains in view local c = centroid(curr[f], curr[s]) v.x = v.x + c.x/oldzoom - c.x/zoom v.y = v.y + c.y/oldzoom - c.y/zoom end -- the interface for dealing with the viewport function M.vx(sx) return M.scale(sx-v.x) end function M.vy(sy) return M.scale(sy-v.y) end function M.scale(d) return d*v.zoom end function M.sx(vx) return v.x + M.iscale(vx) end function M.sy(vy) return v.y + M.iscale(vy) end function M.iscale(d) return d/v.zoom end -- map for heterogeneous array of x, y function M.vxy(arr) local result = {} for i=1,#arr, 2 do table.insert(result, M.vx(arr[i])) table.insert(result, M.vy(arr[i+1])) end return result end -- some helpers -- these feel timeless enough I'm exporting them function centroid(a, b) return{x=(a.x+b.x)/2, y=(a.y+b.y)/2} end function dist(p1, p2) return ((p2.x-p1.x)^2 + (p2.y-p1.y)^2) ^ 0.5 end return M
Comments gratefully appreciated. Please send them to me by any method of your choice and I'll include them here.


 English (US) ·