The Oort cloud is a large shell of icy bodies surrounding the solar system at heliocentric distances 1000 ≲ r ≲ 100,000 au. These bodies are faint and not directly observed, but their existence is inferred from observations of long-period comets (LPCs; J. H. Oort 1950). The so-called new LPCs, which are observed during their first perihelion passage through the inner solar system, often have the semimajor axes between 20,000 and 100,000 au.5 They are thought to have relatively recently evolved, due to the effects of the Galactic tide (J. Heisler & S. Tremaine 1986; Section 3 here), onto high-eccentricity/low-perihelion orbits. The new LPCs have a nearly isotropic distribution of orbital inclinations, suggesting that the outer Oort cloud at r > 10,000 au is roughly spherical (see L. Dones et al. 2015 for a review).
Oort cloud formation dates back to early stages of the solar system some 4.6 Gyr ago (M. Duncan et al. 1987; L. Dones et al. 2004; D. Vokrouhlický et al. 2019). First, as the outer planets cleared their orbital neighborhood, small bodies were scattered onto very eccentric orbits with perihelion distances q ≲ 30 au and semimajor axes a ≳ 1000 au (orbital eccentricities e ≳ 0.97). Second, the Galactic tide raised the perihelion distances of these bodies, effectively decoupling them from planetary perturbations, and tilted their orbits. Third, encounters of the Sun with stars in the Galactic neighborhood thoroughly mixed the orbits in the outer Oort cloud, producing a relatively homogeneous and isotropic source for LPCs.6
Dynamical simulations reveal formation of the inner Oort cloud at 1000 < r < 10,000 au (M. Duncan et al. 1987; H. F. Levison et al. 2001; D. Vokrouhlický et al. 2019).7 The inner Oort cloud forms in much the same way as the outer Oort cloud, except that the timescale on which the Galactic tide changes orbits at 1000 < r < 10,000 au is long, comparable to the age of the solar system. This explains why the inner Oort cloud is not a dominant source of LPCs (D. Vokrouhlický et al. 2019): bodies from this region evolve too slowly and are ejected by planets before they can reach q ≲ 3 au, heat up, and become active comets (J. G. Hills 1981, but see N. A. Kaib & T. Quinn 2009).8 In addition, the orbits with 1000 < a < 10,000 au, which are more strongly bound to the Sun, are less affected by stellar encounters. The inner Oort cloud is therefore often portrayed as a relatively flat disk, roughly aligned with the ecliptic (H. F. Levison et al. 2001), that retained memory of its initial conditions (e.g., M. Fouchard et al. 2018).
In the inner Oort cloud at 1000 < r < 10,000 au, structures in the spatial distribution of bodies can form and "freeze" over timescales comparable to the age of the solar system. This raises the question of how the inner Oort cloud would look to a distant observer and/or whether there are any diagnostic features that would facilitate its detection. Here we show that the inner Oort cloud is a slightly warped disk, roughly 15,000 au across, inclined i ∼ 30° to the ecliptic (nearly polar in the Galactic reference system; Galactic inclination iG ∼ 90°). The disk, when viewed from a distance, would appear as a spiral structure with two twisted arms. The spiral structure was first identified by examining the simulation in the Hayden Planetarium in preparation for a new space show that describes and visualizes the Oort cloud.9 In Section 2, we discuss the results of dynamical simulations—described in the Appendix—to illustrate the inner Oort cloud structure. The analytic model of S. Breiter & R. Ratajczak (2005; also see A. Higuchi et al. 2007) is employed to interpret these results (Section 3). Observational detectability is discussed in Section 4.
Figure 1 shows the Oort spiral as it should appear at the present epoch. The distribution of bodies in the inner Oort cloud was extracted from the Galaxy simulation (D. Nesvorný et al. 2023; see the Appendix here for a description of the simulation setup) and was plotted from a viewpoint of a distant observer. The observer is located at the intersection of the Galactic and ecliptic planes, with the Galactic plane running horizontally across the plot and the ecliptic plane tilted 60 2 to it along the main axis of the spiral. The Sun is in the plot's center. The main axis of the spiral is aligned with the ecliptic—the ends of the spiral are twisted away from the ecliptic. We note that Figure 1 does not incorporate any information about the actual detectability of the inner Oort cloud (for that, see Section 4).
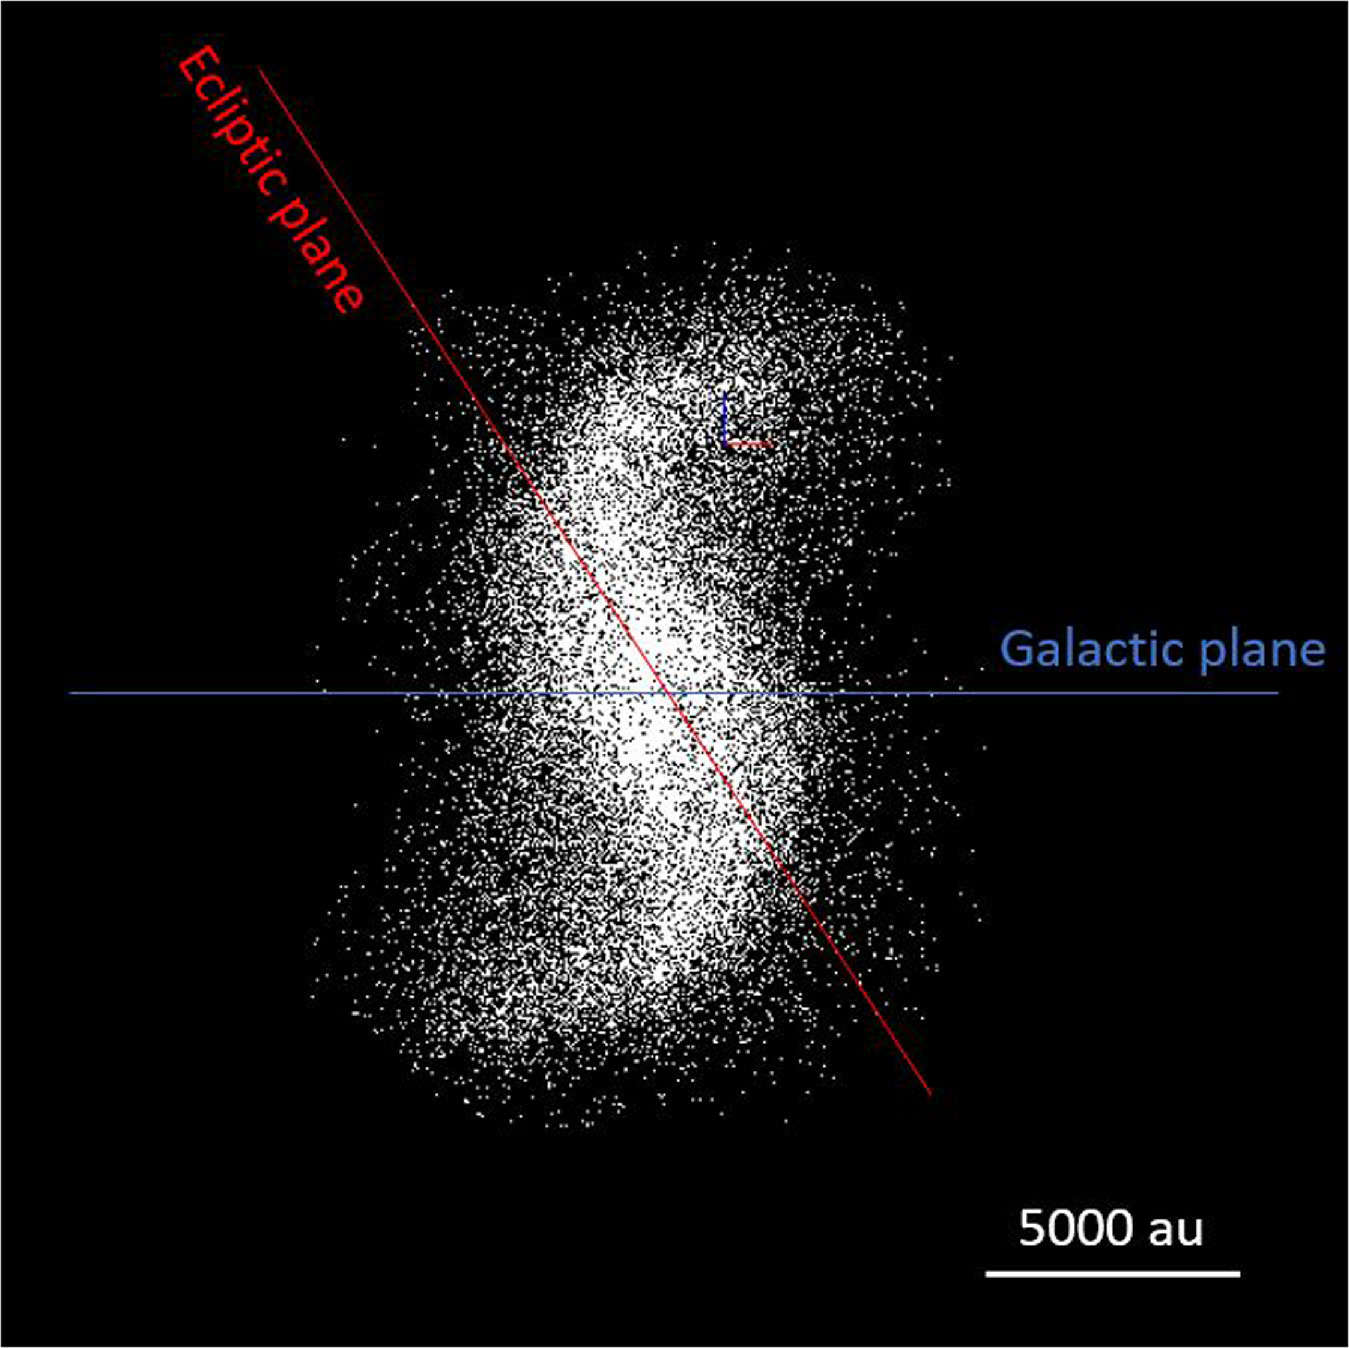
Figure 1. The spiral structure in the inner Oort cloud viewed by a distant observer along the Galactic node direction (intersection of the Galactic and ecliptic planes). The distribution of bodies was obtained from the Galaxy simulation in D. Nesvorný et al. (2023). To show things clearly, here we isolated the inner Oort cloud from the more spherical outer Oort cloud by plotting bodies, 34,000 in total, with a < 5000 au. If the outer Oort cloud were plotted in the figure, it would appear as a large, roughly spherical envelope of the spiral. The classical Kuiper Belt with r < 100 au is not shown here—it would appear as a doughnut-like central concentration of bodies aligned with the ecliptic plane.
Download figure:
Standard image High-resolution imageWe verified that the spiral exists in all our previous simulations with the Galactic tide independently of whether the effects of the stellar cluster were included (D. Nesvorný et al. 2017, 2023; D. Vokrouhlický et al. 2019). The spiral is long-lived: it emerges in the first hundreds of megayears after the formation of the solar system and persists over billions of years. The same spiral structure appears in simulations with different sequences of stellar encounters, indicating that the spiral is not related to stellar encounters. Instead, as we establish below, the spiral is a consequence of the Galactic tide. To simulate the Galactic tide, the Galaxy simulation in D. Nesvorný et al. (2023) adopted the mass density of 0.15 MSun pc−3 in the solar neighborhood. By comparing the results of simulations with different mass densities, we found that the spiral becomes smaller (larger) for higher (lower) stellar densities in the solar neighborhood. This suggests a direct involvement of the Galactic tide.
We studied formation of the Oort spiral by inspecting orbital histories of bodies contributing to the spiral. They were first scattered to 1000 < a < 10,000 au by migrating planets (Neptune, Uranus, and Saturn). The scattered orbits had relatively low orbital inclinations with respect to the ecliptic (i ≲ 30°), low perihelion distances (q ≲ 30 au), and high eccentricities (e ≳ 0.97). The initial nodal longitude and initial perihelion argument of orbits in the ecliptic frame were chosen to be uniformly random. Consequently, the population of scattered bodies initially appeared as a relatively thin disk near the ecliptic, and this—when looked at by an observer in the ecliptic node10 —formed the main axis of the Oort spiral in Figure 1.
The Galactic tide is important for orbits with a > 1000 au. As the ecliptic plane is inclined ≃60 2 with respect to the Galactic plane, bodies scattered near the ecliptic to a > 1000 au had large orbital inclinations in the Galactic frame (iG ∼ 60°) and were subject to Kozai cycles (Y. Kozai 1962; we discuss the Kozai cycles in detail in Section 3). The Kozai cycles produce anticorrelated oscillations of e and iG that are accompanied by a slow evolution of perihelion argument ωG (Figure 2). The fate of an orbit then depends on the initial value of ωG. If 0° < ωG < 90° or 180° < ωG < 270°, the orbital eccentricity increases, the perihelion distance drops, and the body tends to be scattered by planets away from the 1000 < a < 10,000 au region (often to interstellar space).

Figure 2. The orbital elements of bodies in the inner Oort cloud (a ∼ 3000 au). Most orbits in the inner Oort cloud are expected to have ωG = 70°–180° or ωG = 250°–360°. These two broad concentrations in ωG appear as two spiral arms in Figures 1 and 9. The red curves are the evolutionary tracks of e and ωG computed from the analytic model for a = 3000 au and Jz = 0.070534 (see Section 3).
Download figure:
Standard image High-resolution imageIf, instead, 90° < ωG < 180° or 270° < ωG < 360°, the orbital eccentricity initially decreases, and the orbit can decouple from planetary perturbations (Figure 2). These orbits can be stable over long timescales. They stay in the inner Oort cloud and continue to evolve by Kozai cycles. As e decreases in a Kozai cycle, iG increases from the initial value of iG ∼ 60°, and the orbit becomes nearly polar in the Galactic frame. This is when the orbital changes due to Galactic tide become exceedingly slow and orbits freeze (Section 3). This explains the twisted arms of the Oort spiral in Figure 1 that reach away from the ecliptic plane toward the Galactic poles.
The ascending node of the ecliptic on the Galactic plane is located near the Galactic longitude l = 186° (and, by definition, at the Galactic latitude b = 0). In the Galaxy simulation, we observe that orbits in the inner Oort cloud (1000 < a < 10,000 au) start with the nodal longitude ΩG ≃ 186°. Subsequently, if ωG has the right value (see above) and the orbit decouples from planetary perturbations, ΩG slowly rotates in the retrograde sense (Figure 3). Thus, over time, orbits move away from the ecliptic plane, and their initially nearly perfect alignment is (slightly) smeared. The observer looking at the structure along the ecliptic node will then not see the disk exactly edge on, which is the situation shown in Figure 1. For example, for a ∼ 3000 au, the characteristic rotation of ΩG over 4.6 Gyr is broadly centered at ∼30° (Figure 3).
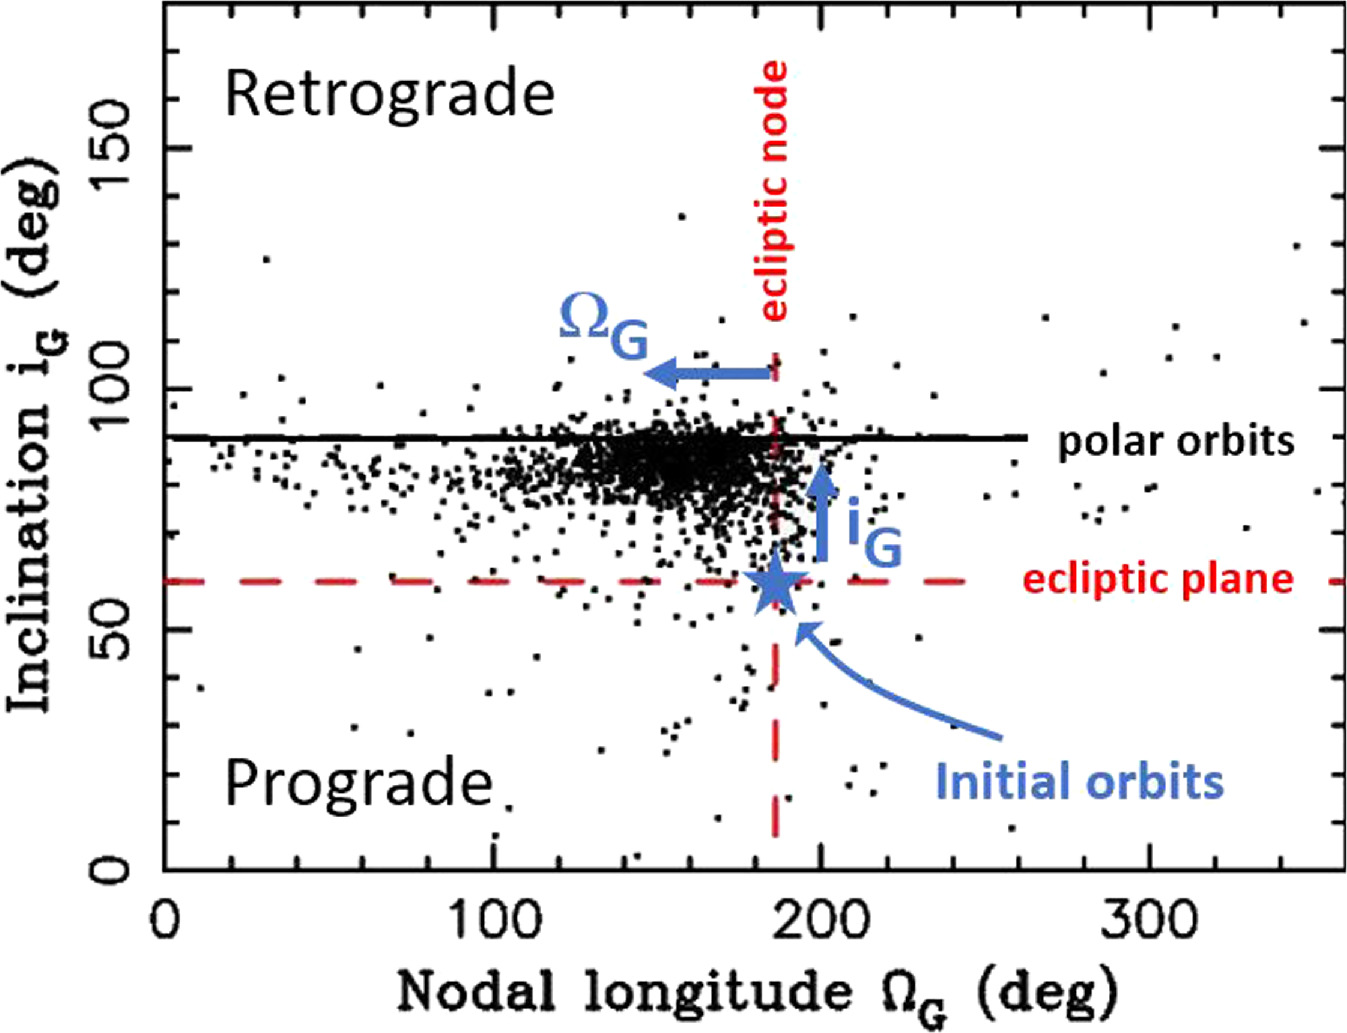
Figure 3. The orbital elements of bodies in the inner Oort cloud (a ∼ 3000 au). The figure shows that bodies in the inner Oort cloud are expected to have nearly polar orbits in the Galactic frame (iG = 75°–90°) and orbital planes that are only slightly rotated away from the ecliptic (ΩG = 120°–180°; the ascending node of the ecliptic is at the Galactic longitude l = 186°—the vertical red line). This implies a disk-like structure in physical space. The blue star is the initial location of bodies scattered by planets near the ecliptic plane.
Download figure:
Standard image High-resolution imageHere we adopt the analytic model from S. Breiter & R. Ratajczak (2005), S. Breiter & R. Ratajczak (2006), and A. Higuchi et al. (2007). The model starts with the Galactic tidal potential from J. Heisler & S. Tremaine (1986) and neglects all components of the tide except the (largest) one that is perpendicular to the Galactic plane. The gravitational potential of planets is neglected as well. This is an appropriate simplification for a > 1000 au, where the effect of Galactic tide is more important than planets (M. Saillenfest et al. 2019). The corresponding Hamiltonian is averaged over the orbital period. Consequently, the semimajor axis a and the z component of (scaled) angular momentum

where iG is the inclination with respect to the Galactic frame, are constant. As Jz remains constant during orbital evolution, e and iG show anticorrelated oscillations defined by Equation (1). The simplified Hamiltonian becomes

where ωG is the argument of perihelion in the Galactic reference system. For any values Jz = const. and C = const., as defined by initial conditions, the evolution of e, iG, and ωG can be obtained from Equations (1) and (2).
The model of S. Breiter & R. Ratajczak (2005) and A. Higuchi et al. (2007) gives explicit expressions, in terms of special functions, for the time evolution of e, iG, ωG, and ΩG. For example, the evolution of eccentricity is

where  and
and  are the minimum and maximum values (both are computed from the initial conditions in S. Breiter & R. Ratajczak 2005),
  is the Jacobian elliptic function, θ(t) is a linear function of time and depends on initial conditions, and the modulus k is a constant obtained from the initial conditions. Once e(t) is solved for, the inclination evolution can be obtained from

The evolution of ωG(t) can then be computed from from Equation (2). Finally, the evolution of the longitude of node ΩG(t) is

where ΩG,i is the initial value of ΩG, A2 and α are constants that can be obtained from initial conditions (S. Breiter & R. Ratajczak 2005; A. Higuchi et al. 2007), and Π is an incomplete elliptic integral of the third kind.
We evaluated e(t), iG(t), ωG(t), and ΩG(t) from S. Breiter & R. Ratajczak (2005) and used it to understand the results of the more complete simulation discussed in Section 2. Before we proceed with this interpretation, note that the Galaxy simulation in Section 2 accounted for (1) the gravitational scattering from migrating outer planets, (2) all three components of the Galactic tide, and (3) stellar encounters—none of these effects is included in the analytic model. At least some of the differences between our Galaxy simulation and the analytic model arise from the neglected effects.
We first checked on the results shown in Figure 1. For that, we generated 34,000 bodies, which is the same as the number of bodies shown in Figure 1, and propagated their orbits with the analytic model for 4.6 Gyr. As a proxy for bodies scattered by planets to the inner Oort cloud distances, the initial orbits were given uniform distributions with 2000 < a < 5000 au, 10 < q < 30 au, i < 30°, and random orbital angles. The spatial distribution of bodies at t = 4.6 Gyr, viewed from the same direction as in Figure 1, is shown in Figure 4. The two plots are similar in that they show the same spiral structure. The one in Figure 4 is less fuzzy, with the two arms standing out more clearly. There is also a concentration of orbits with iG ≃ 90° in Figure 4, forming a vertical line that runs through the plot's center.11

Figure 4. The spiral structure reconstructed by analytical means from S. Breiter & R. Ratajczak (2005). We placed 34,000 bodies onto initial orbits with 2000 < a < 5000 au, 10 < q < 30 au, and i < 30° (inclination with respect to the ecliptic frame). The initial orbital longitudes were chosen at random. The analytic formulas from S. Breiter & R. Ratajczak (2005; also see A. Higuchi et al. 2007) were used to compute the orbits at t = 4.6 Gyr, corresponding to the present epoch. The distribution of bodies at the present epoch was then plotted in the same way as in Figure 1.
Download figure:
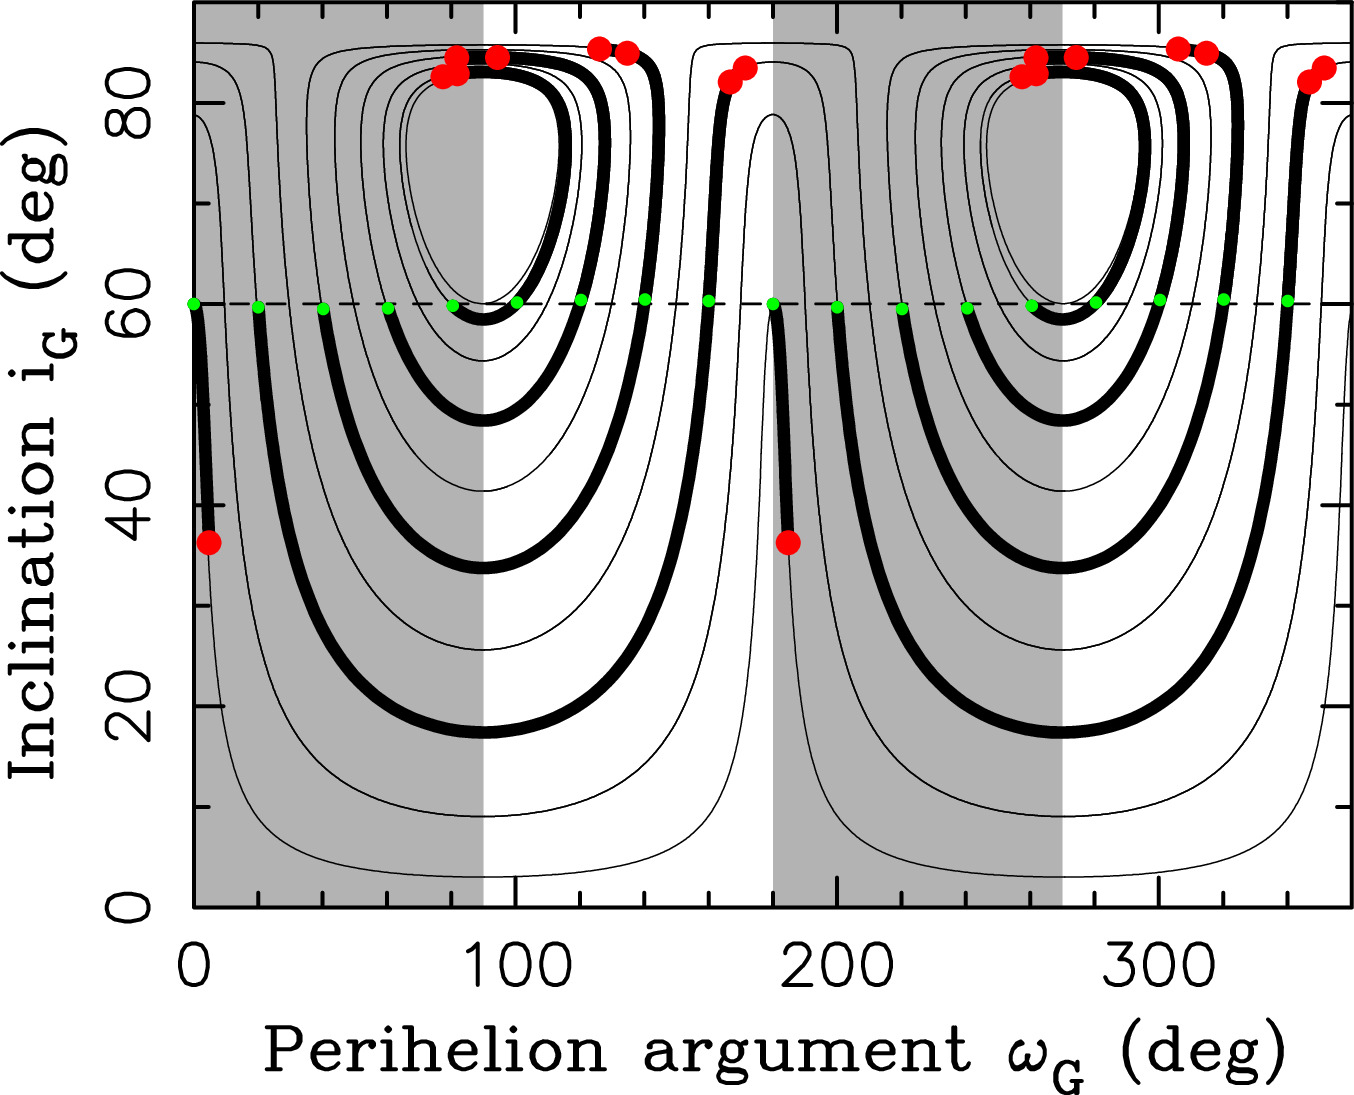
Standard image High-resolution imageTo set up a simple analytic case, we adopted fixed a = 3000 au, e = 0.99, and q = 30 au. We assumed that scattering from the outer planets does not produce very large orbital inclinations with respect to the ecliptic, as indicated by our numerical simulations (i ≲ 30°; D. Nesvorný et al. 2023). For simplicity we therefore set i = 0. This implies iG = 60 2 and ΩG = 186°. With these choices, the orbital evolution only depends on the initial value of ωG (Figures 5 and 6). The results are closely aligned with those discussed in Section 2. If 0° < ωG < 90° or 180° < ωG < 270°, the orbital eccentricity increases (Figure 6), the perihelion distance drops, and the subsequent evolution would be affected by the scattering encounters with planets (not included in the analytic model). This explains why orbits with 0° < ωG < 90° or 180° < ωG < 270° are underrepresented in the Oort spiral.

Figure 5. The Galactic-tide-driven evolution of orbital inclination iG and argument of perihelion ωG, both in the Galactic reference system. The thin lines show trajectories for different values of the C constant (Equation (2)) and Jz = 0.070534 (Equation (1)). To illustrate how bodies in the inner Oort cloud end up on nearly polar orbits in the Galactic frame, we started 18 bodies with iG = 60° and ΩG = 186° (i.e., the initial orbits in the ecliptic plane) and different values of ωG (equally spaced in 20° intervals; green dots on the horizontal dashed line) and let them evolve for 4.6 Gyr (thick trajectories). The red dots label the final orbits. The initial orbits had a = 3000 au, e = 0.99, and q = 30 au.
Download figure:
Standard image High-resolution image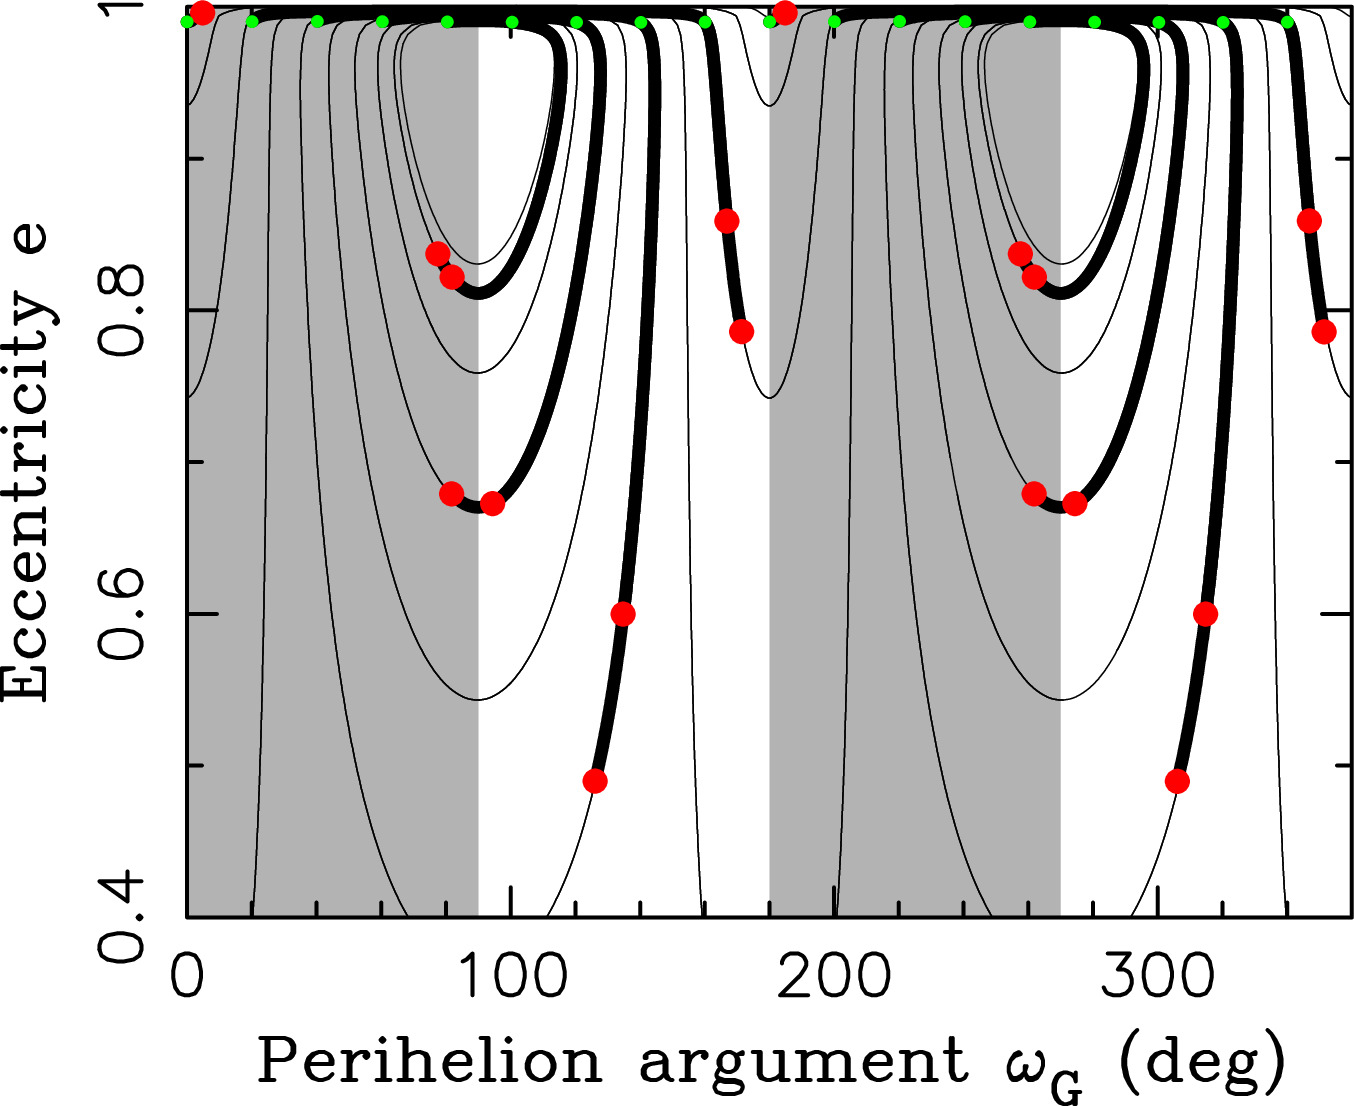
Figure 6. The Galactic-tide-driven evolution of orbital eccentricity e and argument of perihelion ωG. The thin lines show trajectories for different values of the C constant (Equation (2)) and J = 0.070534 (Equation (1)). The green and red dots label the initial and final orbits, respectively. See Figure 5 for additional information.
Download figure:
Standard image High-resolution imageFor 90° < ωG < 180° or 270° < ωG < 360°, the orbital eccentricity initially decreases, so the orbit can decouple from planetary perturbations and become stable. At the same time, as iG of the orbit increases (Figure 5), the orbit becomes nearly polar and practically freezes (red dots in Figure 5). This is a consequence of Equation (2), where C → 0 when iG → 90°, and the orbit evolution becomes exceedingly slow. Two examples of this are shown in Figure 3 in A. Higuchi et al. (2007). The analytic model therefore explains why orbits in the Oort spiral often have iG = 75°–90° (Figure 3). The slow retrograde circulation of ΩG that starts near ΩG = 186° and stalls when iG ≃ 90° complements the picture. It explains why orbits in the inner Oort cloud often have ΩG = 120°–180° (Figure 3).12
The observational detection of the Oort spiral is difficult. The reflected light from large bodies in the inner Oort cloud can be detected by large telescopes. For example, S. S. Sheppard et al. (2019) used the 8.2 m Subaru telescope to discover 541132 Leleākūhonua with a = 1085 au, e = 0.94, and i = 11 7 (original barycentric elements). In the Galactic reference system, we have iG = 50
 4, ΩG = 166°, and ωG = 333°, which would allow us to project 541132 Leleākūhonua in plots like those shown in Figures 2 and 3 (note that the semimajor axis of 541132 is roughly 2–5 times smaller than that of the bodies shown in these figures). We infer that the orbit of 541132 Leleākūhonua must have had a more complex history than simple planet scattering plus Kozai cycles. This is because 541132 Leleākūhonua does not have nearly as polar an orbit in the Galactic frame as the bulk of inner Oort cloud objects in Figure 3. M. Saillenfest et al. (2019) already showed that objects with a ∼ 1000 au are in a transition region where the effects of Galactic and planetary potentials combine to produce dynamical chaos.13
It may have been scattered away from the ecliptic such that the initial inclination was iG < 50°. The Kozai cycles would then plausibly produce the current orbit by decreasing e and increasing iG. Complicating factors include the effects of stellar encounters, stellar cluster, and the possible planet 9 (S. S. Sheppard et al. 2019). In any case, the Oort spiral is mainly contributed by bodies with large perihelion distances and a > 2000 au. The telescopic observations would therefore need to detect objects on even more extreme orbits than 541132 Leleākūhonua, and obtain sufficient statistics for these bodies, to be able to piece together their spatial distribution. This task will have to wait for the next generation of telescopic surveys (e.g., the Vera C. Rubin Observatory).
Figure 7 shows the distribution of inner Oort cloud bodies on the sky as seen from the perspective of a terrestrial observer. The two clouds in Figure 7 correspond to the two spiral arms in Figure 1. The maximum density occurs near the Galactic coordinates l = 340°, b = 30° and l = 160°, b = −20°. We used the multipole expansion to highlight the large-scale features. The multipole expansion of function f is

where θ = 90° − b is the colatitude and ϕ is the longitude, al,m is coefficients, and Yl,m is the spherical harmonics. The coefficients are computed by integration,

over the celestial sphere  , where f(θ, ϕ) is the number density of objects on the sky,
  is the complex conjugate of Yl,m, and
  is the infinitesimal solid angle.

Figure 7. The distribution of inner Oort cloud objects on the sky. We collected bodies with 1000 < a < 3000 au in the Galaxy simulation (Section 2) and show them here from the viewpoint of a terrestrial observer (upper panel). The red lines in the upper panel are lines of constant ecliptic latitudes β = −20°, 0°, and 20°. The bottom panel shows the multipole expansion for l ≤ 3, with the warmer colors indicating higher number densities. The scaling is arbitrary.
Download figure:
Standard image High-resolution imageWe find that the inner Oort cloud distribution is dominated by the quadratic term with l = 2 and m = 2 (Figure 7, bottom panel). For comparison, the distribution of Kuiper Belt objects (KBOs) and scattered disk objects (SDOs) with a < 1000 au is more continuous along the ecliptic (Figure 8). When represented by the multipole expansion, the distribution of KBOs/SDOs appears to be dominated by two quadratic terms with l = 2: m = −1 and m = 2. This offers a criterion for distinguishing the inner Oort cloud objects from KBOs/SDOs: for them the multipole expansion should be dominated by the a2,2 term (∣a2,2∣ ∼ 2∣a2,−1∣). For a more continuous distribution such as the one shown in Figure 8, ∣a2,−1∣ ≳ ∣a2,2∣.

Figure 8. The distribution of KBOs/SDOs on the sky. We collected bodies with 30 < a < 1000 au in the Galaxy simulation (Section 2) and show them here from the viewpoint of a terrestrial observer (upper panel). The red lines in the upper panel are lines of constant ecliptic latitudes β = −20°, 0°, and 20°. The bottom panel shows the multipole expansion for l ≤ 3, with the warmer colors indicating higher number densities. The scaling is arbitrary.
Download figure:
Standard image High-resolution imageDetecting thermal emission from small dust particles in the inner Oort cloud is similarly difficult. For shorter wavelengths, λ ≲ 100 μm, the large-scale thermal emission is dominated by the zodiacal light (e.g., D. Nesvorný et al. 2010; Planck Collaboration et al. 2014). For longer wavelengths, λ ≳ 500 μm, the thermal emission is dominated by the cosmic microwave background (CMB) and Galactic sources (e.g., Planck Collaboration et al. 2020). The CMB shows an anomalous quadrupole term that is somewhat smaller than the expectations from the best-fit cosmological model (D. N. Spergel et al. 2003; Planck Collaboration et al. 2020). The quadrupole moment expected from the inner Oort cloud emission has nearly the opposite orientation on the sky (Figure 7) to that of the CMB quadrupole and would therefore—at least in principle—act to decrease the CMB quadrupole. In practice, however, we estimate that the amplitude of the inner Oort quadrupole should be some 3 orders below that of the CMB quadrupole (∼10 Jy sr−1 for Oort versus ∼10 kJy sr−1 for CMB at frequencies ν ∼ 160 GHz) and therefore negligible.14
The best chances to detect thermal emission from the inner Oort cloud are near wavelengths ∼300–400 μm (E. J. Baxter et al. 2018). This is where the spectral radiance of both the zodiacal and CMB emissions is reduced by a factor of ≳103 from their peak values. The small particles in the inner Oort cloud, ∼10–100 μm, would have temperatures T ∼ 10 K and efficiently emit at these wavelengths. To isolate this component from the zodiacal cloud, one would have to search for an anomalous quadrupole signature corresponding to a distribution that is not completely smooth in the ecliptic longitude and peaks near the expected directions (Figure 7). To separate it from the CMB, one would have to demonstrate that the amplitude of the CMB quadrupole moment decreases—relative to lower and higher multipole moments—for these intermediate wavelengths.
The high-frequency instrument on board the Planck satellite observed at 857 GHz, which translates to λ ≃ 350 μm. A careful analysis of these observations could perhaps unveil some interesting features. But even here the prospects of the inner Oort cloud detection are feeble. A complication arises because the thermal signal from the inner Oort particles scales with 1/r2 and temperature  . Thus, even though these particles spend more time near aphelion, where they contribute to the Oort spiral, they are much more easily detectable when they approach the terrestrial observer during their perihelion passage. This creates a strong bias in detectability of particles with small perihelion distances; these particles have high eccentricities and a different distribution on the sky than the one shown in Figure 7. Unfortunately, we do not have enough statistics in the Galaxy simulation to accurately predict the expected signature from this population.
Finally, we briefly comment on E. J. Baxter et al. (2018), who used the high-frequency Planck detector (545 and 857 GHz) to search for signatures of exo-Oort clouds around nearby (hot) stars. They found several candidates but pointed out that the rate of false positives in these observations is expected to be relatively high. They argued that future CMB surveys and targeted observations with far-infrared and millimeter wavelength telescopes have the potential to detect exo-Oort clouds or other extended sources of thermal emission beyond ∼1000 au from the parent stars. Here we point out that resolving a spiral-like signature such as the one shown in Figure 1 or Figure 9 would potentially represent more definitive evidence for the existence of the (inner) exo-Oort cloud around a nearby star. For the exo-Oort spiral to form, there needs to be a planetary system capable of ejecting small bodies to ∼1000–10,000 au from its host star, and the orbital plane of the ejected bodies needs to be significantly inclined to the Galactic plane for the Kozai cycles to happen.

Figure 9. A top view of the Oort spiral from the perspective of a distant observer at the Galactic plane. The plot shows the same bodies as in Figure 1, but the view is rotated by 90° around the Galactic pole. The yellow curves highlight the two spiral arms.
Download figure:
Standard image High-resolution imageWe used numerical simulations and analytical methods to demonstrate that the inner Oort cloud is a warped disk with a spiral structure roughly 15,000 au in length (Figures 1 and 9). The spiral forms when small bodies are scattered by planets to 1000–10,000 au and orbitally evolve by the Galactic tide. At 1000–10,000 au, where the dynamical timescales are comparable to the age of the solar system, the Galactic tide acts to (a) raise perihelion distances and decouple bodies from planetary perturbations, (b) rotate orbital planes such that they evolve to become nearly perpendicular to the Galactic plane (and ΩG = 120°–180°; Figure 3), and (c) favor long-term stability of orbits with 90° < ωG < 180° and 270° < ωG < 360°. Item (b) implies that the inner Oort cloud would look like a disk to a distant observer. Item (c) implies two preferred directions for orbits distributed in the disk. As the preferred directions depend on the period of Kozai oscillations (Section 3 and A. Higuchi et al. 2007), which in turn depends on the semimajor axis, the inner Oort cloud bodies appear to be concentrated in two spiral arms (Figure 9).
In retrospect, the existence of the Oort cloud spiral could have been inferred from Figure 3 in M. Fouchard et al. (2018), where the nonuniformity of orbital angles corresponds to the spiral structure reported here. The structure was not present in Figure 1 of M. Fouchard et al. (2018), which corresponds to an initially isotropic Oort cloud, showing that the spiral structure is indeed linked to the initial state of the Oort cloud (i.e., orbital scattering of bodies from the outer planet region along the ecliptic). Additionally, M. Fouchard et al. (2018, 2023) identified a related group of LPCs (B3) with properties that would reflect the structure of the inner Oort cloud—the so-called "empty ecliptic" feature; this feature was identified in LPC catalogs (M. Fouchard et al. 2023). In this sense, the Oort cloud spiral has (indirectly) been detected.
Direct observational detection of the Oort spiral is difficult. Either (i) this structure can be pieced together from detection of a large number of objects with a > 1000 au and q > 30 au, or (ii) the thermal emission from small particles in the Oort spiral will be separated from various foreground and background sources. As for (ii), perhaps the best chance is to scrutinize emission at intermediate wavelengths (λ ∼ 100–500 μm; e.g., Planck's 857 GHz detector) and demonstrate excess emission that is not fully continuous in ecliptic longitude (i.e., not from the zodiacal cloud) and deviates in some significant way from the low-degree multipoles observed at longer wavelengths (i.e., not a CMB quadrupole). Observational detection of Oort spirals around Milky Way stars is similarly challenging (E. J. Baxter et al. 2018).
The Galaxy simulation was performed on the NASA Pleiades Supercomputer. We thank the NASA NAS computing division for continued support. The work of DN was funded by the NASA EW program. D.V. acknowledges support from the grant 25-16507S of the Czech Science Foundation. J.F., J.P., and C.E. acknowledge the support from NASA grant #80NSSC23K0602.
Here we make use of the dynamical model from D. Nesvorný et al. (2023). To start with, we disregard their cases with the stellar cluster and focus on the simulation called Galaxy. This simulation included the (1) migration model for the outer planets, (2) effects of planet scattering on disk planetesimals, and (3) Galactic potential and stellar encounters. The model results were calibrated on Dark Energy Survey (DES) detections of objects in the trans-Neptunian region (P. H. Bernardinelli et al. 2022). Here is a brief description of these components:
(1) Migration model. The numerical simulations consisted of tracking the orbits of the four giant planets (Jupiter to Neptune) and a large number of planetesimals. Uranus and Neptune were initially placed inside of their current orbits and were migrated outward. The swift_rmvs4 code, part of the Swift N-body integration package (H. F. Levison & M. J. Duncan 1994), was used to follow all orbits. The code was modified to include artificial forces that mimic the radial migration and damping of planetary orbits. The migration history of planets was informed by the best models of planetary migration/instability. Specifically, they adopted the migration model s10/30j from D. Nesvorný et al. (2020) that worked well to satisfy many constraints. See that work for a detailed description of the migration parameters (e.g., migration e-fold timescale τ = 10 Myr for t < 10 Myr and instability at t = 10 Myr). The migration model also accounted for the jitter that Neptune's orbit experienced due to close encounters with massive bodies (D. Nesvorný & D. Vokrouhlický 2016).
(2) Planetesimal Disk. The simulations included one million disk planetesimals distributed from 4 au to beyond 30 au. Such a high resolution was needed to obtain good statistics for the Oort cloud. The initial surface density of disk planetesimals was assumed to follow the truncated power-law profile from D. Nesvorný et al. (2020; also see R. S. Gomes et al. 2004). The step in the surface density at 30 au was parameterized by the contrast parameter c ∼ 103, which is simply the ratio of surface densities on either side of 30 au (the planetesimals with initial a > 30 au are not an important source for the Oort cloud). The initial eccentricities and inclinations of orbits were set according to the Rayleigh distribution with scale parameters σe = 0.1 and σi = 0.05. The disk bodies were assumed to be massless such that their gravity did not interfere with the migration/damping routines.
(3) Galactic potential and stellar encounters. The Galaxy was assumed to be axisymmetric, and the Sun followed a circular orbit in the Galactic midplane (the Sun's migration in the Galaxy was not included; N. A. Kaib et al. 2011). The Galactic tidal acceleration was taken from J. Heisler & S. Tremaine (1986; see also P. Wiegert & S. Tremaine 1999; H. F. Levison et al. 2001). The stellar mass density in the solar neighborhood was set to ρ0 = 0.15 M⊙ pc−3. The simulations accounted for the effect of stellar encounters. The stellar mass and number density of different stellar species were computed from J. Heisler et al. (1987). The stars were released and removed at the heliocentric distance of 1 pc (206,000 au). For each species, the velocity distribution was approximated by the isotropic Maxwell–Boltzmann distribution. The dynamical effect of passing molecular clouds was ignored.
(4) Calibration on observations. The Galaxy simulation was run over 4.6 Gyr, at which point the orbital distribution of bodies in the trans-Neptunian region was compared with DES observations (P. H. Bernardinelli et al. 2022). DES covered a contiguous 5000 deg2 of the southern sky between 2013 and 2019, with the majority of the imaged area being at high ecliptic latitudes. The search for outer solar system objects yielded 812 KBOs with well-characterized discovery biases, including over 200 SDOs with a > 50 au. The DES survey simulator15 (P. H. Bernardinelli et al. 2022) was used to bias the model in the same way as the data. D. Nesvorný et al. (2023) made use of DES observations to calibrate the magnitude distribution of trans-Neptunian objects and establish that the dynamical model results were consistent with DES observations. The model fidelity was previously tested from observations of short-period comets (D. Nesvorný et al. 2017) and LPCs (D. Vokrouhlický et al. 2019).


 English (US) ·